The Learner Dashboard is a customizable dashboard designed for users in the Learner Experience (LX). On the learner dashboard, users can view their training progress along with other statistics that you choose.

Use the links below to learn more about the Learner Dashboard. You can also check out our Learner Dashboard Video for a visual overview.
Enable the Learner Dashboard
When the Learner Dashboard is enabled, users can see a summary of their training completion, including their training status and due dates. You can also choose to display the Phishing Information, Risk Information, Badges, and Leaderboard tiles. Follow the steps below to enable the learner dashboard.
- In your KSAT console, click your name at the top-right corner of the page.
- From the drop-down menu that opens, select Account Settings.
- Navigate to Training > Learner Experience > Learner Dashboard
- Select the Enable Learner Dashboard check box to enable the Learner Dashboard.
Once you enable the Learner Dashboard, two more options will display. You can select the Enable Phishing Information check box to enable the Phishing Test Results tile, and you can select the Enable Risk Information check box to enable the Personal Risk Score tile.
Use the Learner Dashboard
When the Learner Dashboard is enabled, your users can view information about their training progress, incomplete training, and assignments. If you have selected the Enable Phishing Information and Enable Risk Information check boxes, your users can view additional phishing and Risk Score information as well.
To learn more about the information available on the Learner Dashboard, see the subsections below.
Training Information
By default, the learner dashboard includes the Training Progress tile and a list of the user's recent training assignments. The learner dashboard only displays information from active training campaigns.
The Training Progress tile shows the percentage of completed training assignments and includes a link to the training section of the LX.

The assignment list displays the five highest-priority assignments, along with the training status and due date. Users can access a specific training assignment by clicking on its corresponding row. For detailed information on how training assignments are prioritized, refer to the Training Assignment Ordering Logic article.
Messages
If your organization has used the User Messaging feature, any user who has received a message can see the Messages tile on their Learner Dashboard. This tile indicates the number of unread messages a user has. Users can click View Messages to go to the Messages tab. For more information about messages, see our User Messaging Guide.

Phishing Information
If your organization has enabled the Phishing Information option, users will see the Phishing Test Results tile on their Learner Dashboard.
This tile shows the number of phishing emails the user reported and the number of failures on phishing tests, compared to the total number of simulated phishing emails they received.
The Reported Phishing Emails bar graph displays the number of simulated phishing emails that the user has reported without failing the phishing test. The Phishing Failures bar graph displays the number of negative interactions that users have had with a simulated phishing email, such as replying, downloading attachments, and clicking links in the email.

Risk Information
If your organization has enabled the Risk Information option, users can see the Personal Risk Score tile on their Learner Dashboard. This tile shows the user’s Risk Score along with a brief explanation of how the score is calculated. This tile also includes a link to our Learner Support: SmartRisk™ Engine and Risk Score article, which users can read to learn more about what their Risk Score means and how to improve it.

Badges and Leaderboard
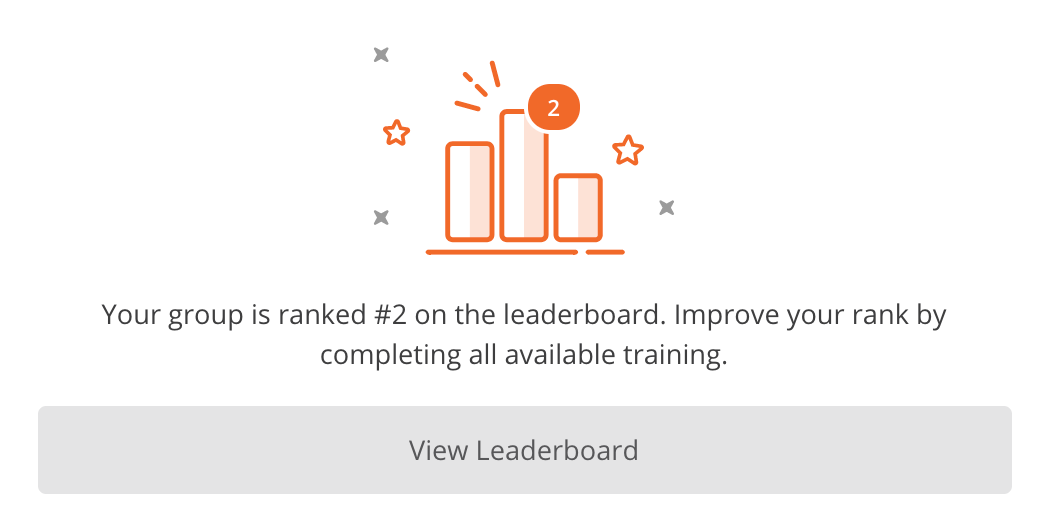
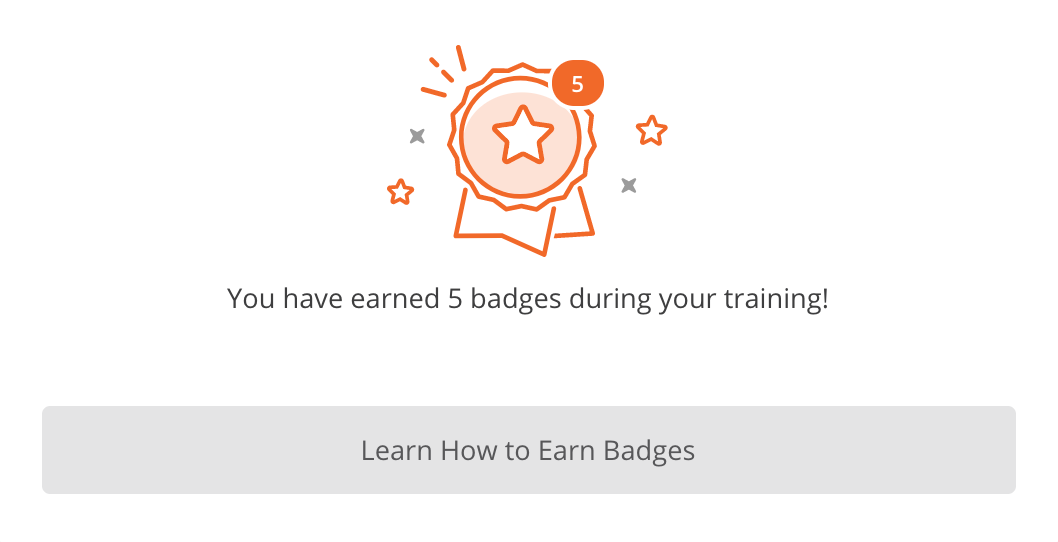
If your organization has enabled badges and leaderboards, users can view the Badges and Leaderboard tiles.
The Badges tile shows how many badges that the user has earned. The user can also click Learn How to Earn Badges to go to the Badges tab.
The Leaderboard tile shows where the user or their group ranks and links to the Leaderboard tab.