Our SmartRisk™ Engine feature provides more in-depth analysis with tailored recommendations to help you better understand your organization’s security strengths and weaknesses. You can use SmartRisk™ Engine to learn which users may be more vulnerable to phishing attacks and review the effectiveness of your security awareness training program.
SmartRisk™ Engine assigns dynamic Risk Scores to your users, groups, and organization. You can use these Risk Scores to make data-driven decisions for your organization's security.
KnowBe4 records a unique Risk Score for your users, groups, and organization. Your Risk Score is calculated using risk factors from various security types, which are our groupings for risk factors. Risk factors include specific events that can be positive, such as reporting a phishing email with the Phish Alert Button (PAB), or negative, such as clicking a phishing link.
Risk Scores increase when users fail phishing tests, engage in risky behaviors, or have their training completion statuses expire. Conversely, users can improve their scores by reporting phishing emails via the PAB and completing all assigned training modules.
It’s important to remember that:
- Risk Scores update automatically based on tracked behaviors. No manual adjustments are possible.
- Organizational factors like missing security products can also influence scores.
For more technical information about Risk Score and commonly asked questions and answers, see our FAQ: SmartRisk™ Engine and Risk Score Guide.
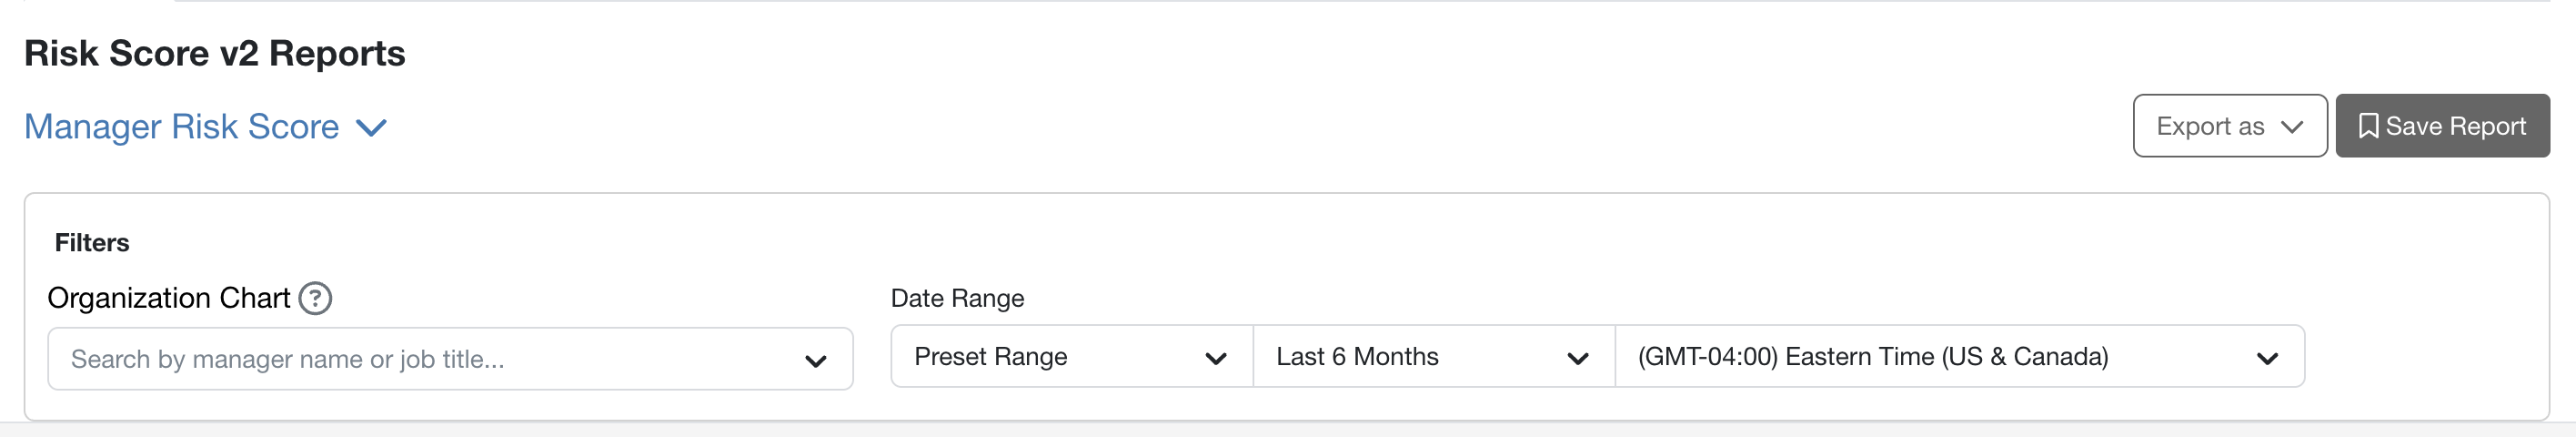
Depending on your report type, you can filter your Risk Score Reports by Date Range, groups, managers, or users.
On the Manager Risk Score report, you can use the Organization Chart to filter your report by user name or job title. This filter shows user data for all organization levels under the selected managers or job titles. For example, you can search for a specific job title, such as Director or Vice President. You can also select from the two options below:
- Select Include All Team Members to include the direct and indirect reports of the selected managers in the report.
- Select Include Selected Manager to include the selected manager in the report.
Available Range
Risk factors from security types inform your organization’s available range. Your available range indicates your level of risk, with zero being the least risky and 100 being the most risky.

Your available range for Risk Score is also calculated using the information provided by our products, such as SecurityCoach or PasswordIQ. While having all of our products isn't a requirement for Risk Score, it helps us to provide you with a more accurate available range for your Risk Score. For more information on possible available ranges, see the table below. These ranges are calculated based on products that are enabled and actively used.
| Enabled Products and Features | Minimum Risk Score | Maximum Risk Score |
|---|---|---|
| KSAT Training tab | 27.7 | 47.2 |
| KSAT Phishing tab | 38.2 | 45.1 |
| KSAT Training tab and Phishing tab | 26.0 | 52.4 |
| KSAT Training tab, Phishing tab, and Phish Alert Button (PAB) | 21.7 | 55.0 |
| KSAT Training tab, Phishing tab, PAB, and Email Exposure Check (EEC) Pro | 20.6 | 58.2 |
| KSAT Training tab, Phishing tab, PAB, EEC Pro, and PasswordIQ | 19.7 | 60.9 |
| KSAT Training tab, Phishing tab, PAB, EEC Pro, PasswordIQ, and SecurityCoach | 10 | 90 |
New User Bias
Whenever you add a new user to your console, a new user bias is applied to your active security types for 90 days to reflect the inherent risk of a new user without an established security history. If a new user engages in secure actions, the bias for that specific security type is removed in the next Risk Score calculation. For more information about the new user bias, see the Calculation section of our FAQ: SmartRisk™ Engine and Risk Score Guide.
Security Types
The Security Types widget shows how your Risk Score has changed for each security type. A green arrow indicates that your Risk Score decreased, a red arrow indicates that your Risk Score increased, and a gray line indicates that your Risk Score didn’t change. You can click the arrow to view more details about each security type. For more information, see the screenshot and list below:

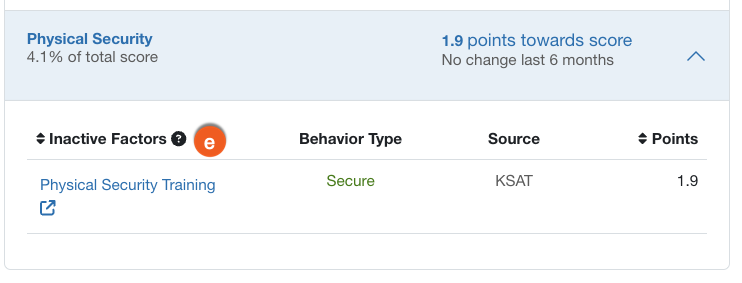
- Active Factors: This column displays risk factors that are from security types with active products that are enabled and actively used.
-
Behavior Type: This column indicates if the behavior was risky or secure. Risky behavior increases your Risk Score, while secure behavior decreases your Risk Score.
Note: Mitigation events also positively impact your Risk Score. Currently, mitigation events include SecurityTips, AIDA Remedial Training completions, and resolved PasswordIQ vulnerability scans. -
Source: This column indicates which product contributed to the risk factor.
Note:In this report, events influenced by the User Event API are sourced to their KnowBe4 product. -
Points: This column displays the current Risk Score contribution for the selected risk factor as well as the overall trend change in your Risk Score. The overall trend change will be displayed as going up or down from the last recorded Risk Score.
Note:Expiring risky events may decrease your Risk Score, and expiring secure events may increase your Risk Score. Each risk factor has its own time-to-live (TTL) value, so events only impact your Risk Score for a set amount of time. - Inactive Factors: This column displays risk factors that are from security types that have no products. Since we aren’t receiving data, we set the Risk Score value for these factors.
For more information on each security type and example risk factors, see the table below.
| Security Type | Description | Example Risk Factor |
|---|---|---|
| Email Security | Email Security reflects risks from a user’s email usage and interactions. | Reporting a phishing email with the PAB |
| Endpoint Security | Endpoint Security reflects risks posed by a user’s interaction with their device. | Malware detected on a user’s device |
| Data Security | Data Security reflects risks from data that a user shares. | Sharing files to an external device |
| Web Security | Web Security reflects risks from a user’s online behavior. | Visiting harmful websites |
| Account Hygiene | Account Hygiene reflects a user's overall security awareness related to their accounts. | Having a strong password |
| Compliance Electives | Compliance Electives reflect a user’s training completions related to compliance topics. | Completing security awareness training related to compliance |
| Physical Security | Physical Security reflects a user’s training completions related to physical security. | Tailgating |
Risk Score Trend
The Risk Score Trend chart shows the trend of your organization's aggregated Risk Score over the selected date range.

Risk Score Distribution
The Risk Score Distribution chart shows how users in your organization are distributed across different Risk Score ranges for the selected date range.

Riskiest Users
The Riskiest Users chart shows the top ten riskiest users for your selected report and your select date range. A green arrow indicates that your Risk Score decreased, a red arrow indicates that your Risk Score increased, and a gray line indicates that your Risk Score didn’t change. To filter your chart by your safest users, select the Riskiest Users drop-down menu, then select Safest Users.

Riskiest Teams
The Riskiest Teams chart shows the top ten riskiest teams of direct reports for your Manager Risk Score report and your selected date range. A green arrow indicates that your Risk Score decreased, a red arrow indicates that your Risk Score increased, and a gray line indicates that your Risk Score didn’t change. To filter your chart by your safest teams, select the Riskiest Teams drop-down menu, then select Safest Teams.

Riskiest Groups
The Riskiest Groups chart shows the top ten riskiest groups for the selected groups in your Group Risk Score report and your selected date range. A green arrow indicates that your Risk Score decreased, a red arrow indicates that your Risk Score increased, and a gray line indicates that your Risk Score didn’t change. To filter your chart by your safest groups, select the Riskiest Groups drop-down menu, then select Safest Groups.
