KnowBe4’s Account Management Reporting feature provides actionable metrics and insight into the effectiveness of the KnowBe4 Security Awareness Training programs running on your managed accounts.

Creating Reports
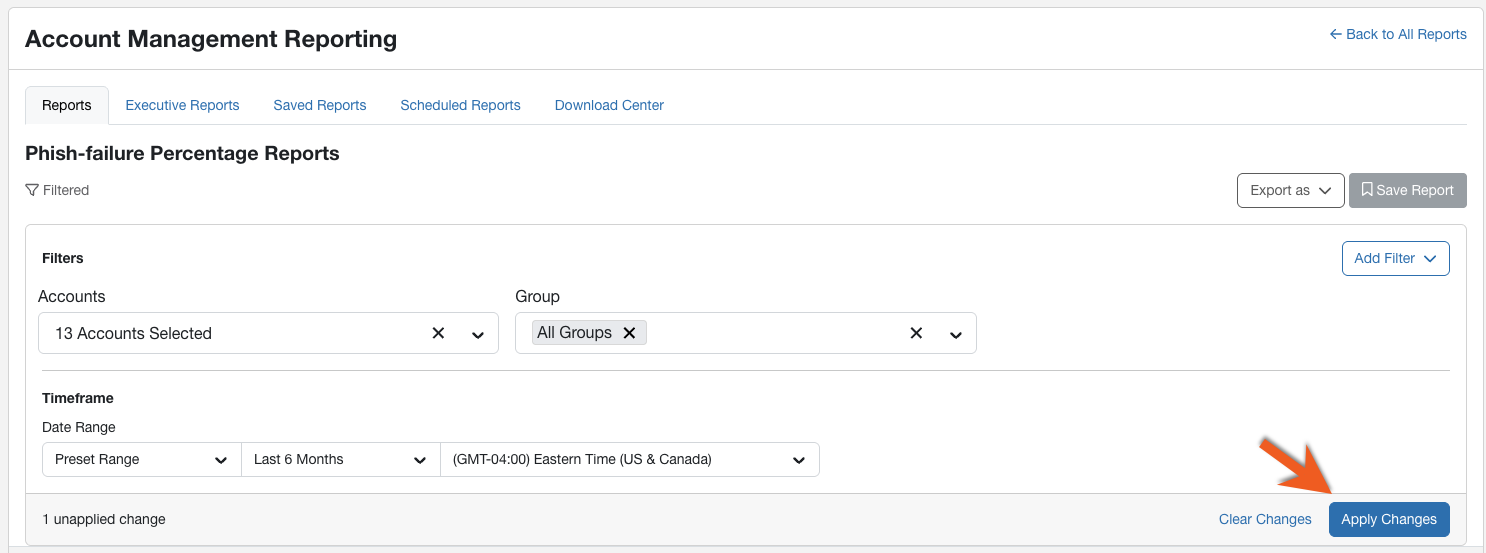
To create an on-demand report, log in to your KSAT Account Management console and navigate to the Reports tab > Reports subtab. Then, follow the steps below:
- Once you find the report you want to view, click the report name.
- When the report opens, filter the data by defining the report type and criteria from the drop-down menus. Learn more about available report types and criteria in the Report Categories and Types section of this article.
- Once customized, click Apply Changes to update the report.
All reports, except Account Report cards, can be downloaded as a PDF or CSV file.
To download the report, click the Export as drop-down menu near the top-right of the page. You can click either Generate CSV to download the report as a CSV file or Generate PDF to download the report as a PDF file. Downloaded reports will be in the language of the user who initiated the download.
Report Categories and Types
We offer several different report categories, types, and filters to help you customize your reports.

The Combine Results filter, available on select reports, will combine your selections into one trendline so you can analyze the selected data as a group.
To learn more about our available categories, types, filters, and suggested use cases, click a report category or specific report from the list below.
Account Report Cards
Account Report Card
Description: This report displays a summary by account of the following information:
- Account Risk Score
- Account Phish-prone Percentage
- User Counts
- Top 5 Clicked Emails
- Training Status Overview By Campaign
Filters: Account and Date Range.
Use Cases: This information can act as an executive summary to show the overall risk and status of the KnowBe4 Security Awareness Training for your managed accounts. This report can also be used to assess the training statuses of an account or determine what types of phishing emails users in that account are prone to click.
Learner Platform Report
All Training Activity per Platform
Description: View a report about your learners’ completed training by platform.
Filters: Accounts, Group, Training Additional Criteria, Training Campaigns, User Status, Date Range, Content Types, and Platform.
Use Cases: Use this information to keep your managed accounts on track with their training and determine when to send training notifications or reminders. You can also use this report to show a summary of completed training.
Phishing Activity Reports
Our available Phishing Activity Reports are listed below. To learn more about Phishing Activity Reports, see our Customize and View Phishing Activity Reports article.
All Phishing Activity
Description: View a report about your managed accounts’ overall phishing activity by Phishing Security Test (PST).
Filters: Accounts, Group, Phishing Campaign Criteria, Phishing Campaigns, Phishing Security Test Outcome, User Status, Date Range, Template Attack Vectors, and Search User.
Use Cases: You can use this report to view combined data about your accounts' overall PST results.
All Phishing Activity Grouped by User
Description: View a report about the Phishing Security Test (PST) activity of your managed accounts, with the results grouped by user.
Filters: Accounts, Group, Phishing Campaigns, User Status, Date Range, Template Attack Vectors, and Search User.
Use Cases: You can use this report to view combined data about the PST results of your accounts’ user groups.
Phish-failure Percentage Report
Our available Phish-failure Percentage Reports are listed below. For more information about the Phish-failure Percentage, see our How Phish-failure Percentage is Calculated article.
Phish-failure Percentage
Description: This report displays the average Phish-failure Percentage of selected users.
Filters: Accounts, Group, Date Range, and Combine Results.
Use Cases: See how likely selected accounts are to fail a phishing attack. Use this information to pinpoint which of your accounts need additional training or if their Phish-failure Percentage has improved over time.
Phish-prone Percentage Reports
Our available Phish-prone Percentage Reports are listed below. For more information about the Phish-prone Percentage, see our Failures and Phish-prone Percentages article.
Phish-prone Percentage
Description: This report displays the average Phish-prone Percentage of selected users.
Filters: Accounts, Group, Date Range, and Combine Results.
Use Cases: See how susceptible a specific account is to phishing attacks. Use this information to determine if a user needs more training time or if their Phish-prone Percentage has improved.
Phish-prone Percentage by Training Time
Description: This report compares the time spent training to the average Phish-prone Percentage in the selected accounts or groups.
Filters: Accounts, Group, Date Range, and Combine Results.
Use Cases: Identify which phishing campaign caused the most phishing test failures. Use this information to pinpoint the type of training users need the most or pinpoint the type of attack method users are most vulnerable to.
Risk Score Report
For more information about Risk Score, see our SmartRisk Agent™ and Risk Score Guide.
Account Risk Score
Description: This report displays the average Risk Score of the selected accounts.
Filters: Accounts and Date Range
Use Cases: Determine your most at-risk accounts and adjust or modify their security awareness training.
Training Activity Reports
Our available Training Activity Reports are listed below. To learn more about Training Activity Reports, see our Customize and View Training Activity Reports article.
All Training Activity
Description: View a report about your accounts’ training activity by enrollment.
Filters: Accounts, Group, Training Additional Criteria, Training Campaigns, Content Types, User Status, Training Status Criteria, Training Progress Status, Search User, Enrolled On Date Range, Training Started Date Range, and Training Completed Date Range.
Use Cases: You can use this report to view combined data about overall training activity for your accounts’ users.
All Training Activity Grouped by User
Description: View a report about your accounts’ training activity by enrollment, grouped by user.
Filters: Accounts, Group, Training Additional Criteria, Training Campaigns, Content Types, User Status, Training Status Criteria, Training Progress Status, Search User, Enrolled On Date Range, Training Started Date Range, and Training Completed Date Range.
Use Cases: You can use this report to view combined training activity data for your accounts’ users and user groups.
Training Comparison Reports
Phish-prone Percentage Comparison
Description: This report displays the average Phish-prone Percentage for trained and untrained users in the selected accounts or groups.
Filters: Accounts, Group, and Combine Results.
Use Cases: See how training affects your managed accounts by comparing the Phish-prone Percentage of untrained and trained users.
Risk Score Comparison
Description: This report displays the average Risk Score for trained and untrained users in the selected accounts or groups.
Filters: Accounts, Group, and Combine Results.
Use Cases: See how training affects your specific managed accounts by comparing the Risk Scores of untrained and trained users.
Training Status Overview Reports
Training Status Overview by Campaign
Description: This report displays your accounts’ users in the selected campaigns, organized by user training status.
Filters: Accounts, Training Campaigns, and Date Range.
Use Cases: Use this information to keep your managed accounts on track with their training and determine when to send training notifications or reminders.
Training Status Overview by Course
Description: This report is organized by the courses in selected campaigns. It displays the total number of users under each training status.
Filters: Accounts, Training Campaigns, and Date Range.
Use Cases: Use this information to keep your managed accounts on track with their training courses and determine when to send training notifications or reminders.
Coverage by Account
Description: This report displays the total number of users by group in each training status for all campaigns.
Filters: Accounts, Group, and Date Range.
Use Cases: Use this information to keep all or specific managed accounts on track with their training and determine when to send training notifications or reminders.
User Count and Login Reports
User Count
Description: This report displays the number of active users in the selected accounts or groups.
Filters: Accounts, Group, Date Range, and Combine Results.
Use Cases: Use this information to track changes in user numbers across all of your managed accounts or review the number of active users for each managed account.
User Login Activity
Description: This report displays the login activity of active users in the selected accounts or groups.
Filters: Accounts, Group, and Date Range.
Use Cases: Use this information to view all user login activity across multiple groups and accounts. This information may help determine which groups and accounts are not actively participating in their security awareness training.
Frequently Asked Questions
What Date Range filter options are available?
See the chart below for an explanation of the available options for the Date Range filter:
| Date Range | Description |
|---|---|
| Preset Range | Choose from a list of preset ranges. For more information, see the What Preset Range options are available for the Date Range filter? section below. |
| Month Range | Choose how many prior months you want to include in the report results. |
| Week Range | Choose how many prior weeks you want to include in the report results. |
| Custom Range | Choose your own custom date range to include in the report results. |
What Preset Range options are available for the Date Range filter?
See the chart below for an explanation of the available Preset Range options for the Date Range filter:
| Date Range | Description |
|---|---|
| Week to Date | Pulls data that matches the specified criteria and that occurred between last Sunday and now. |
| Month to Date | Pulls data that matches the specified criteria and that occurred between the last day of the month and now. |
| Last Year | Pulls data that matches the specified criteria and that occurred between January 1 of last year and January 1 of this year. |
| Last Quarter | Pulls data that matches the specified criteria and that occurred during the last business quarter. For example, the data could occur from January through March, April through June, July through September, or October through December. |
| Last Month | Pulls data that matches the specified criteria and that occurred during the last calendar month. |
| Last 6 Months | Pulls data that matches the specified criteria and that occurred during the last six months, including the current month. |
| Year to Date | Pulls data that matches the specified criteria and that occurred between January 1 of the current year and now. |
| Last 30 Days | Pulls data that matches the specified criteria and that occurred during the last 30 calendar days. |
| Last 90 Days | Pulls data that matches the specified criteria and that occurred during the last 90 calendar days. |
How can I search for a specific account or user group?
In the Accounts filter field, you can type in the name of your desired account to search. In the Group filter field, you can type in the name of your desired user group to search.
How can I search for all users in an account?
Create an “All Users” group for any of your accounts with ease by creating Smart Groups in each of your client accounts. Create an “All Users” Smart Group by using the following Smart Group criteria:
-
User Field: The primary e-mail must contain @
