Real-Time Coaching offers a range of reports that provide insight into your organization's security risks, detection rules, and coaching activity. These reports can help you understand where you may need to improve your security awareness program and track trends in your users' risky activity over time.
To view these reports in your KnowBe4 console, navigate to Coaching > Reports. To learn more about the specific reports, view the sections below.
Real-Time Coaching Report
The Real-Time Coaching Report provides an overview of your Real-Time Coaching category activity. To access this report, find the Real-Time Coaching Report tile and select Report.
For more information on this overview, see the following screenshot and list:
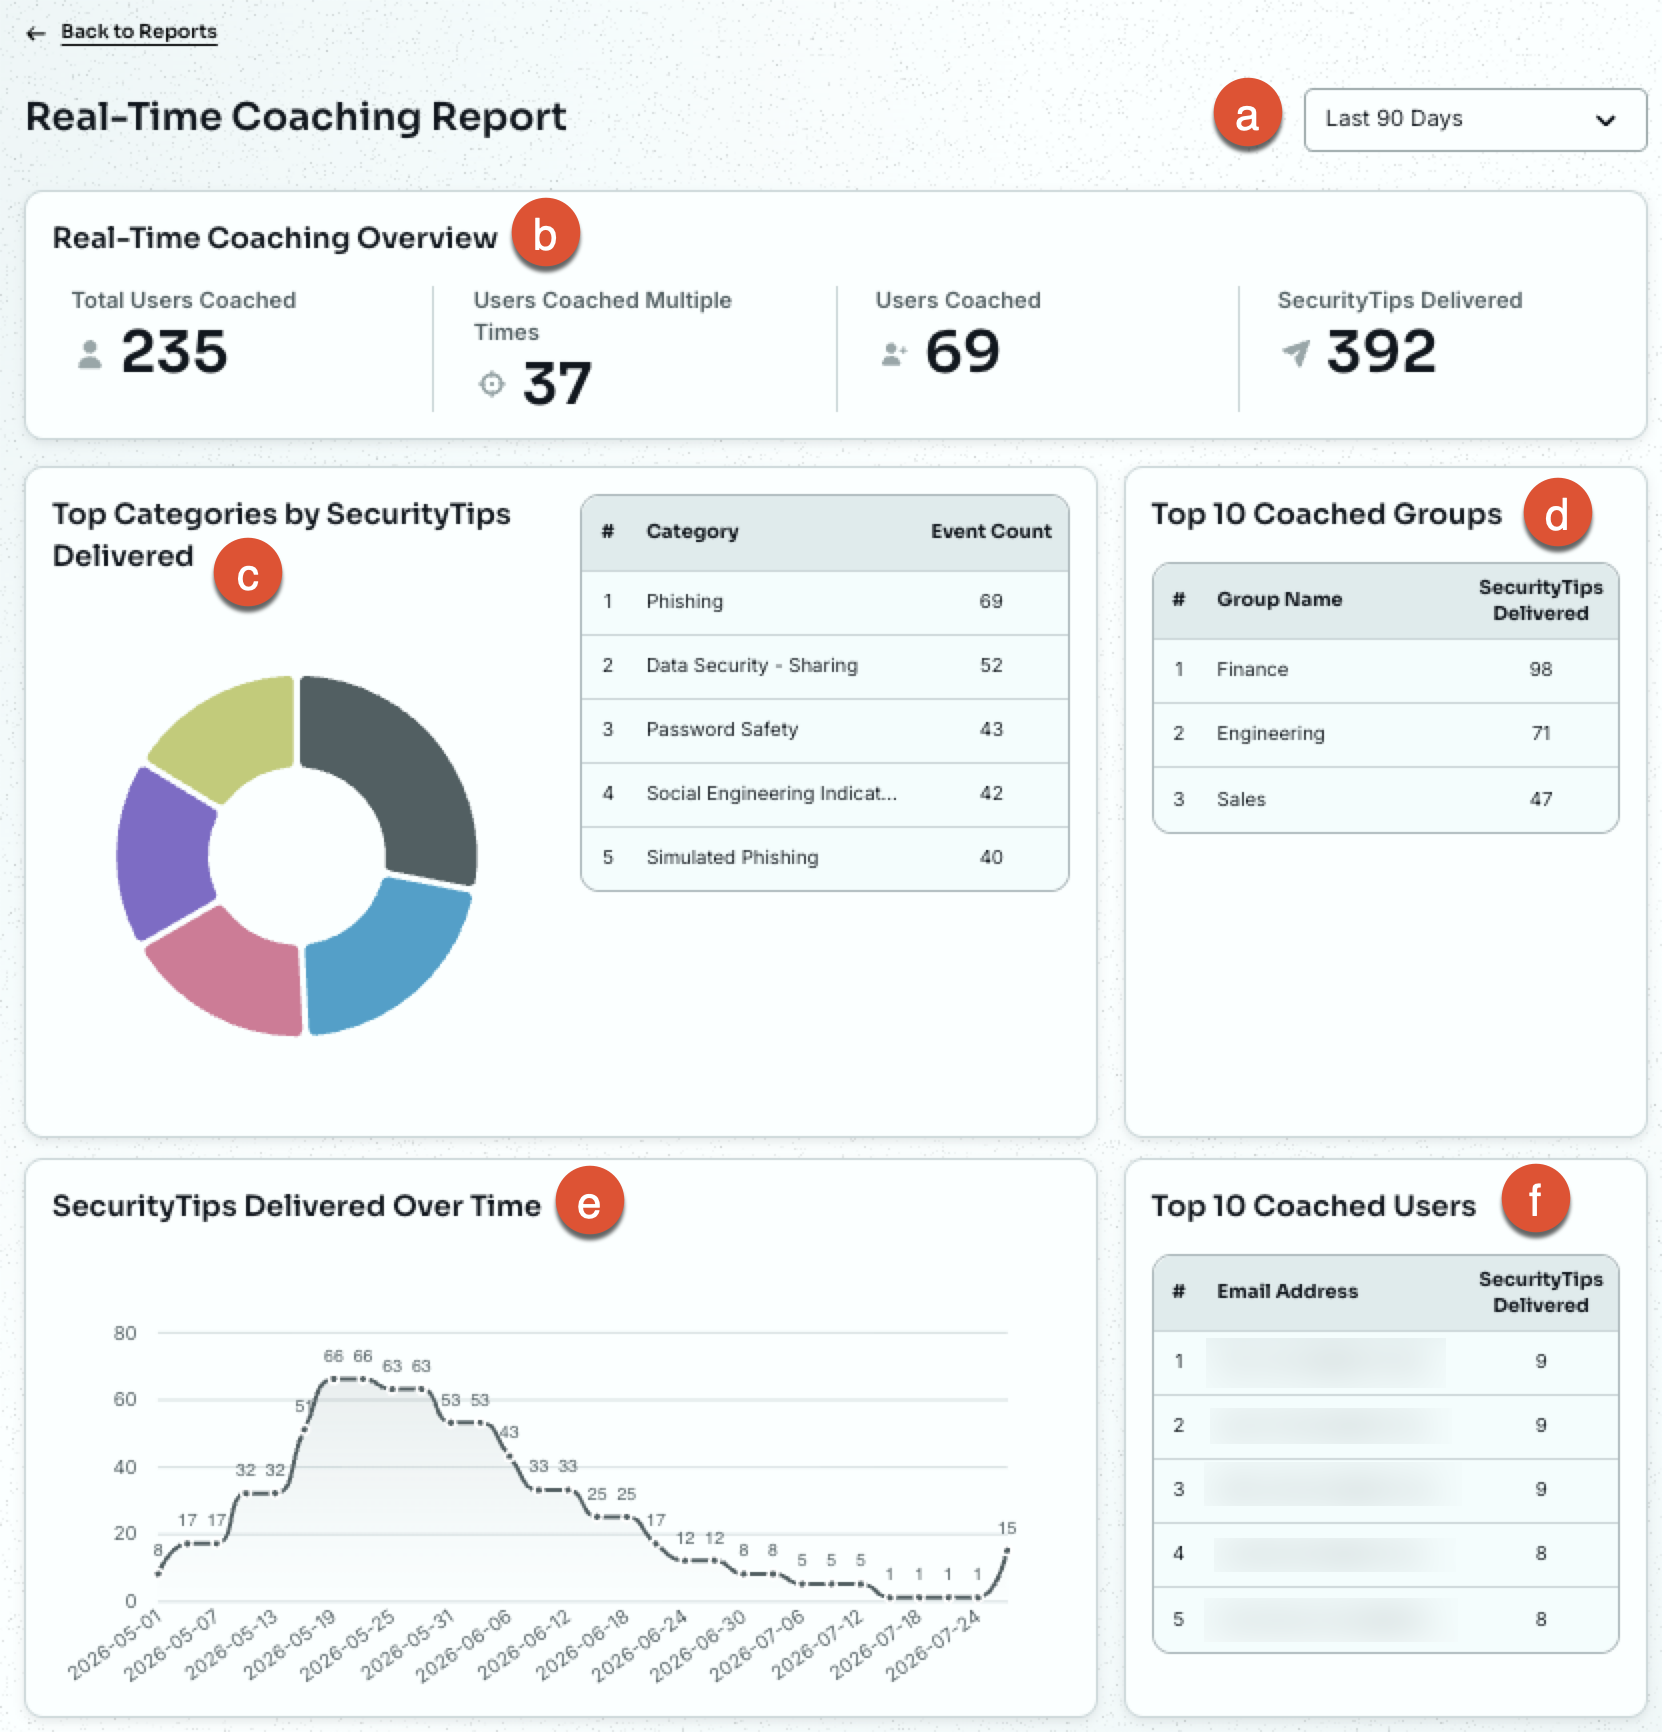
- Time Range Filter: Adjust the time range to show reporting data for. By default, this report displays data and activity from the last 90 days.
-
Real-Time Coaching Overview: This section provides information about your coaching categories.
- Total Users Coached: The number of users that received SecurityTips during the selected date range.
- Users Coached Multiple Times: The number of users who received more than one SecurityTip during the selected date range.
- New Users Coached: The number of users that received a SecurityTip during the selected date range who had never received one before.
- SecurityTips Delivered: The total number of SecurityTips delivered to users during the selected date range.
- Top Categories by SecurityTips Delivered: This chart displays up to 10 categories with the most detections of risky activity during the selected date range.
- Top 10 Coached Groups: A table listing the Smart Groups that received the most SecurityTips during the selected date range.
- SecurityTips Delivered Over Time: A graph showing changes in the number of SecurityTips delivered during the selected date range.
- Top 10 Coached Users: A table listing the users who received the most SecurityTips during the selected date range. Includes up to 10 users.
Customizing and Exporting the Real-Time Coaching Report
To access this report’s source data, find the Real-Time Coaching Report tile and select Source Data.
You can customize the report data based on criteria such as Real-Time Coaching categories, user groups, or delivery methods. You can also export this report as a CSV file, save it, send it, and schedule it for future sending.
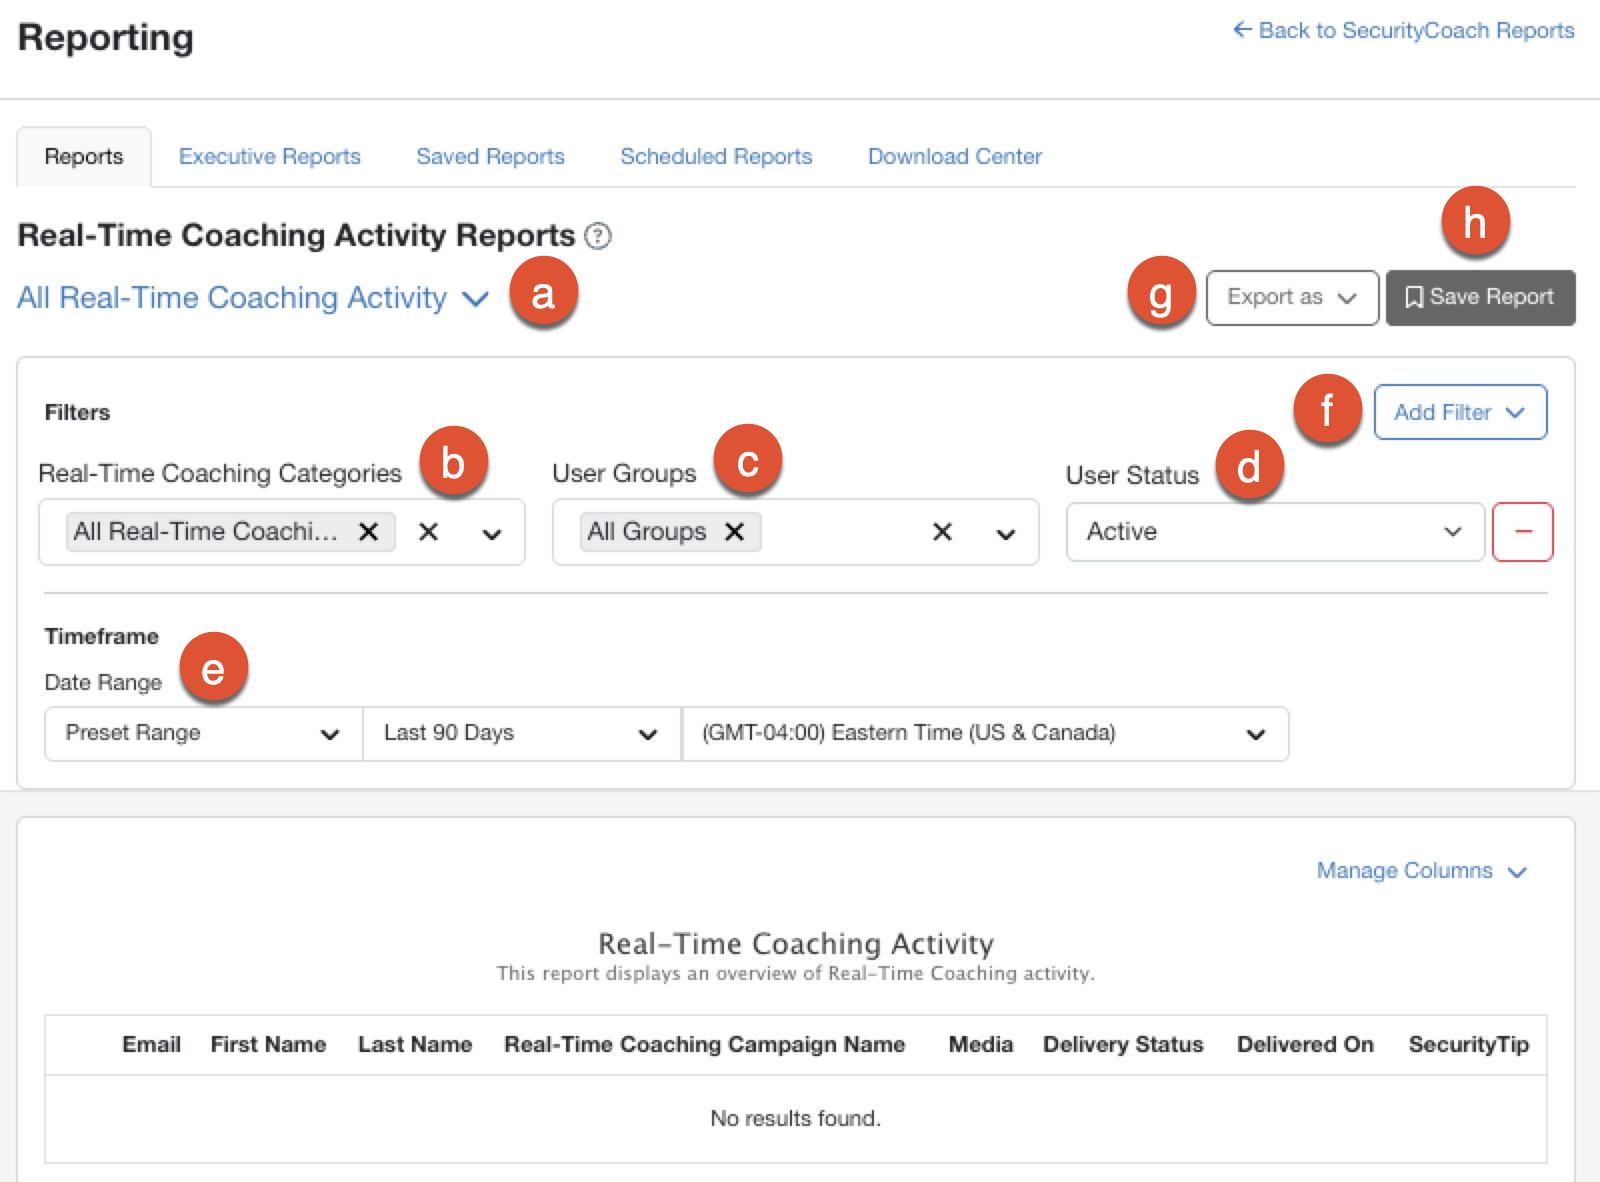
For more information on customizing and exporting this report, see the following screenshot and list:
-
Report Type: Select the arrow icon to choose which report type to generate:
- All Real-Time Coaching Activity: View detailed information for your organization's overall coaching activity.
- All Real-Time Coaching Activity Grouped by User: View combined coaching activity data for each user.
- Real-Time Coaching Categories: Select specific categories to include, or keep the default selection to include all categories.
- User Groups: Select the user groups to include, or keep the default selection to include all groups.
- User Status: Select All User Statuses, Active, or Archived.
- Date Range: Select the date range for the data.
-
Add Filter: Add additional optional filters, including:
- Delivery Methods: Select the SecurityTip delivery methods to include. Options include All Delivery Methods, Email, Slack, Microsoft Teams, or Google Chat.
- User Groups Criteria: Select the types of user groups to include. Options include All Group Types, Console, Smart Groups, or User Provisioning.
-
Only Show New Users Coached: Select this option to only display users who received their first SecurityTip during the selected date range.
Note:This filter is only available for the All Real-Time Coaching Activity Grouped by User report type. -
Delivered Notifications: Use this filter to select the number of delivered SecurityTips to include for each user. You can select Any, 1, More than 1, or More than 5.
Note:This filter is only available for the All Real-Time Coaching Activity Grouped by User report type.
- Export as: Export the generated report as a CSV file, available for download in the Download Center.
- Save Report: Save the report to your Saved Reports subtab.
Once you apply your filters and generate the report, a table will display with information about your organization's coaching activity. Use the Manage Columns drop-down menu to select which columns to display.
Detection Rules Report
The Detection Rules Report provides an overview of your active detection rules. To access this report, find the Detection Rules Report tile and select Report.
For more information on this overview, see the following screenshot and list:
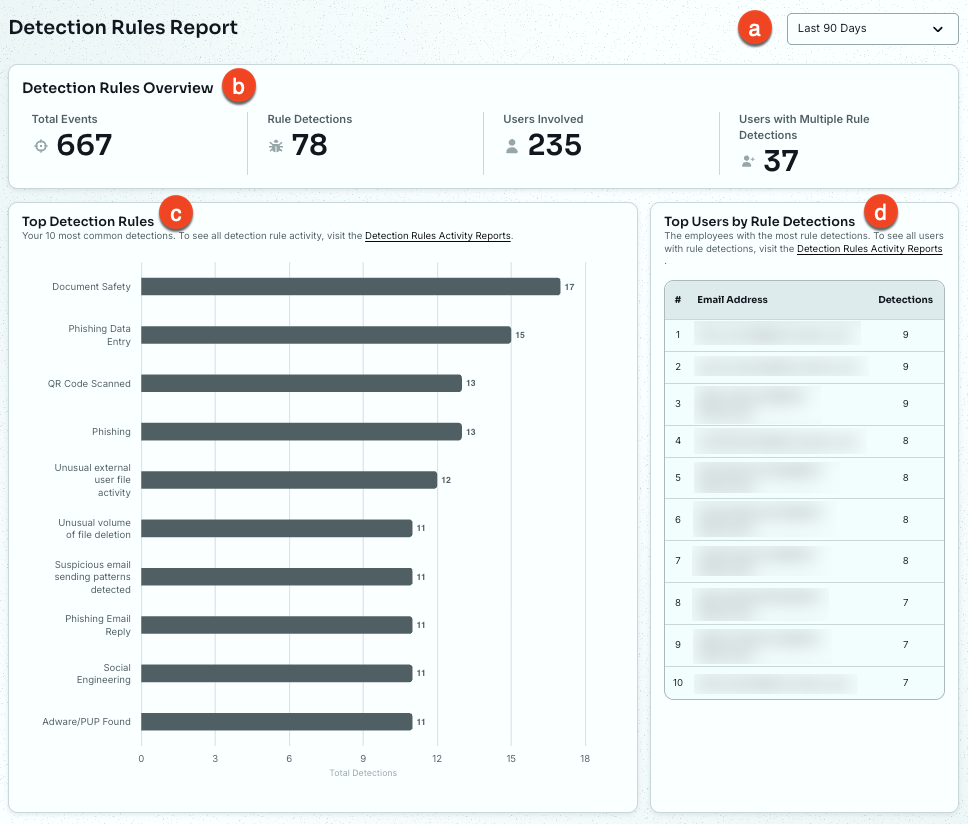
- Time Range Filter: Adjust the time range to show reporting data for. By default, this report displays data and activity from the last 90 days.
-
Detection Rules Overview: This section provides information about your detection rules.
- Total Events: The total number of events during the selected date range.
- Rule Detections: The number of events that triggered a detection rule during the selected date range.
- Users Involved: The number of mapped users that triggered a detection rule during the selected date range.
- Users with Multiple Rule Detections: The number of users who triggered two or more detection rules during the selected date range.
- Top Detection Rules: A graph showing the number of users with detections for your organization's most-detected rules during the selected date range. Shows up to 10 detection rules.
- Top Users by Rule Detections: A table showing the number of rule detections for your organization's riskiest users. Shows up to 10 users.
Customizing and Exporting the Detection Rules Report
To access this report’s source data, find the Detection Rules Report tile and select Source Data.
You can customize the report data based on criteria such as detection rule categories, vendors, or risk levels. You can also export this report as a CSV file, save it, send it, and schedule it for future sending.
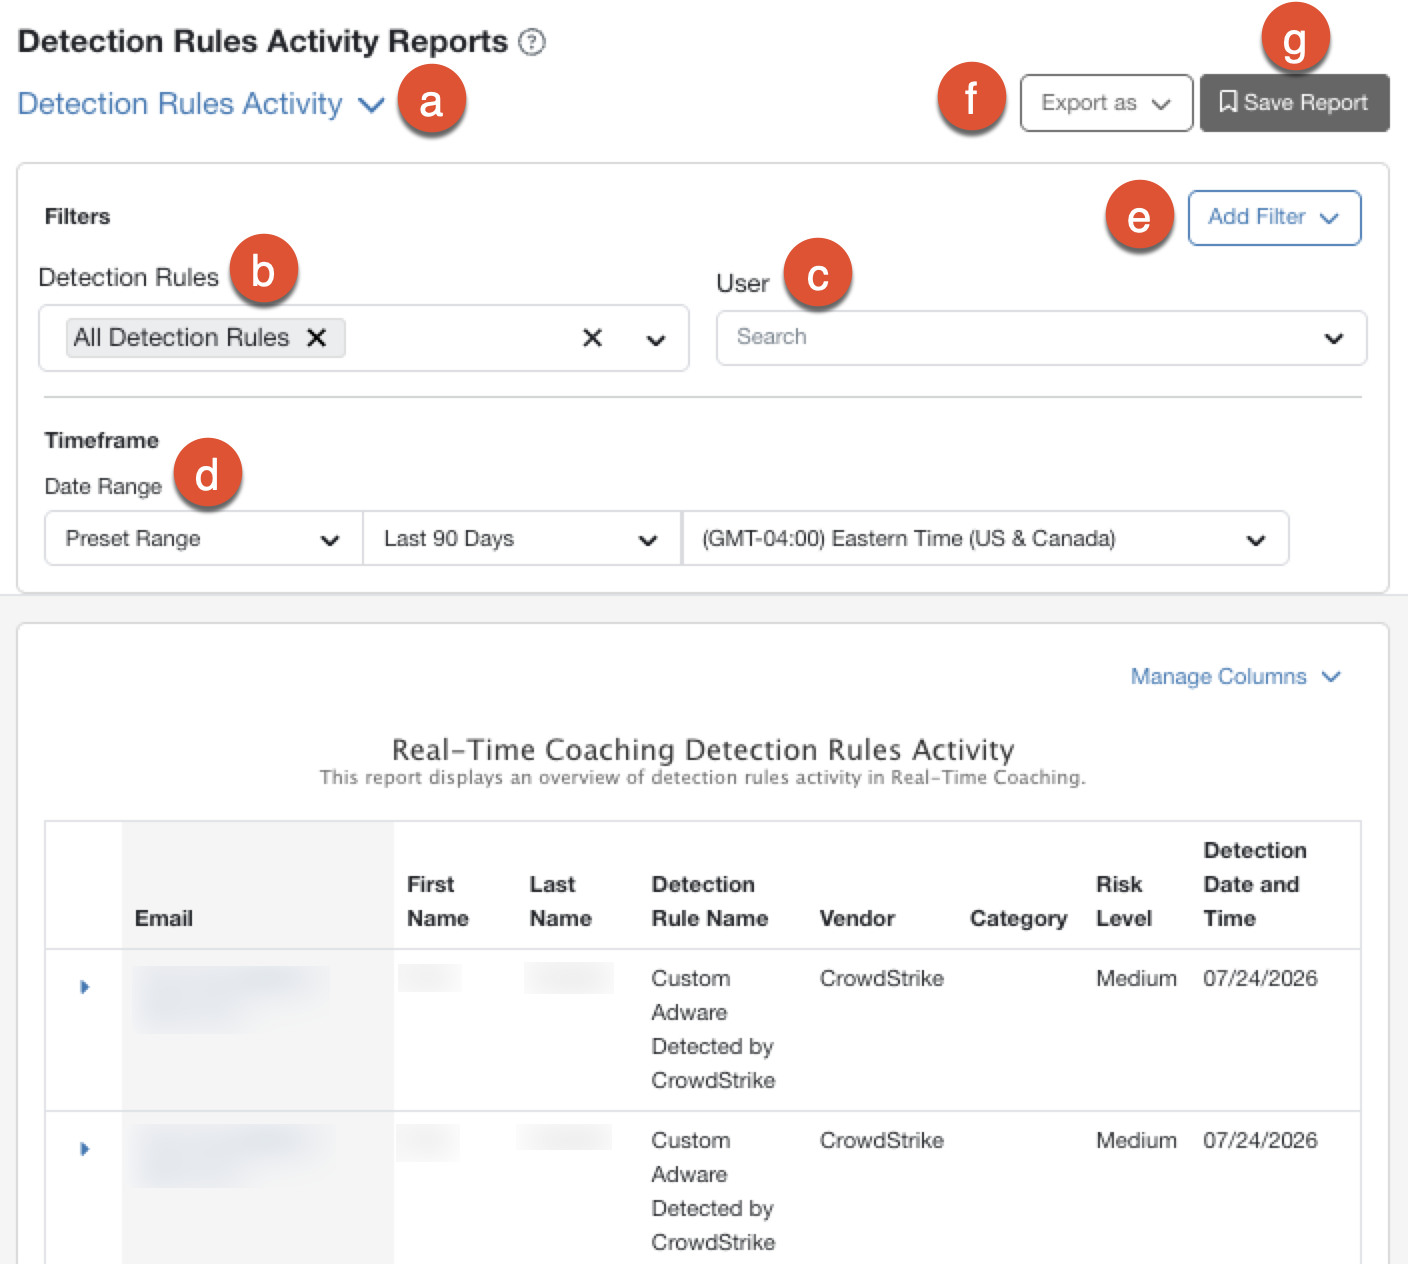
For more information on customizing and exporting this report, see the following screenshot and list:
-
Report Type: Select the arrow icon to choose which report type to generate:
- Detection Rules Activity: View detailed information for each individual rule detection.
- Detection Rules Activity Grouped by User: View combined data for each user's rule detections.
- Detection Rules Activity Grouped by Detection Rule: View combined data for each detection rule.
- Detection Rules: Use this filter to select the detection rules that you would like to display in this report.
-
User: Use this search bar to select or enter the name of a user that you would like to display in this report.
Note:This filter is only available for the Detection Rules Activity and Detection Rules Activity Grouped by User report types. - Date Range: Use this filter to select the date range that you would like to display in this report.
-
Add Filter: Use this drop-down menu to add additional optional filters to your report.
- Detection Rule Categories: Use this filter to select the detection rule categories that you would like to display in this report.
- Vendors: Use this filter to select the vendors that you would like to display in this report.
-
Risk Levels: Use this filter to select the risk levels that you would like to display in this report. Options include All Risk Levels, Medium, High, or Very High.
Note:This filter is only available for the Detection Rules Activity and Detection Rules Activity Grouped by Detection Rule report types.
- Export as: Use this button to export the generated report as a CSV file. CSV files you generate will be available for download in the Download Center.
- Save Report: Use this button to save the report to your Saved Reports subtab.
Once you apply your filters and generate the report, a table will display with information about your organization's rule detections. Use the Manage Columns drop-down menu to select which columns to display.
Vendor Events Report
The Vendor Events Report displays events from your integrated vendors that are linked to detection rules. To access this report, find the Vendor Events Report tile and select Report. Use this information to ensure that your most common events are covered by coaching from active categories. To include more events in your report, create custom detection rules or integrate more security vendors.
For more information on this overview, see the following screenshot and list:
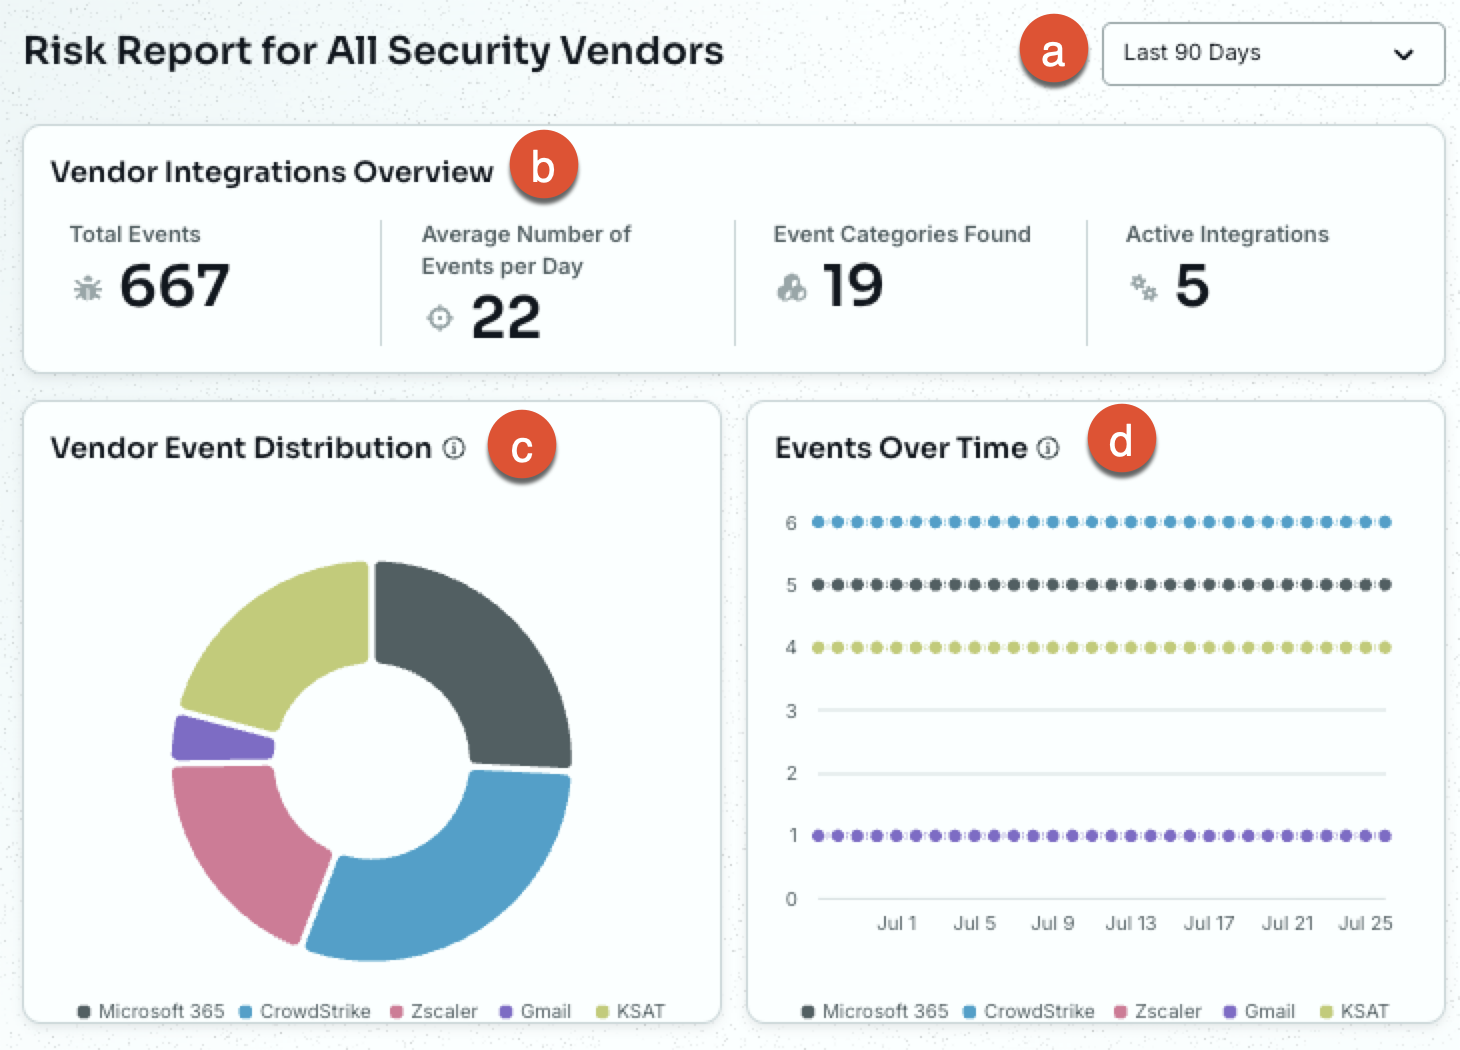
- Time Range Filter: Adjust the time range to show reporting data for. By default, this report displays data and activity from the last 90 days.
-
Vendor Integrations Overview: This section provides information about your vendor integrations.
- Total Events: The total number of events from your integrated vendors during the selected date range.
- Average Number of Events per Day: The average number of events per day during the selected date range.
- Event Categories Found: The number of distinct event categories detected during the selected date range.
- Active Integrations: The number of vendors you currently have integrated.
- Vendor Event Distribution: A chart showing the percentage of events attributable to each of your integrated vendors.
- Events Over Time: A graph showing the change in events for each integrated vendor over the selected date range.
Customizing the Vendor Events Report
To access this report’s source data, find the Vendor Events Report tile and select Source Data.
You can customize the report data based on criteria such as vendors, detection rules, or event data.
For more information on customizing this report, see the following screenshot and list:
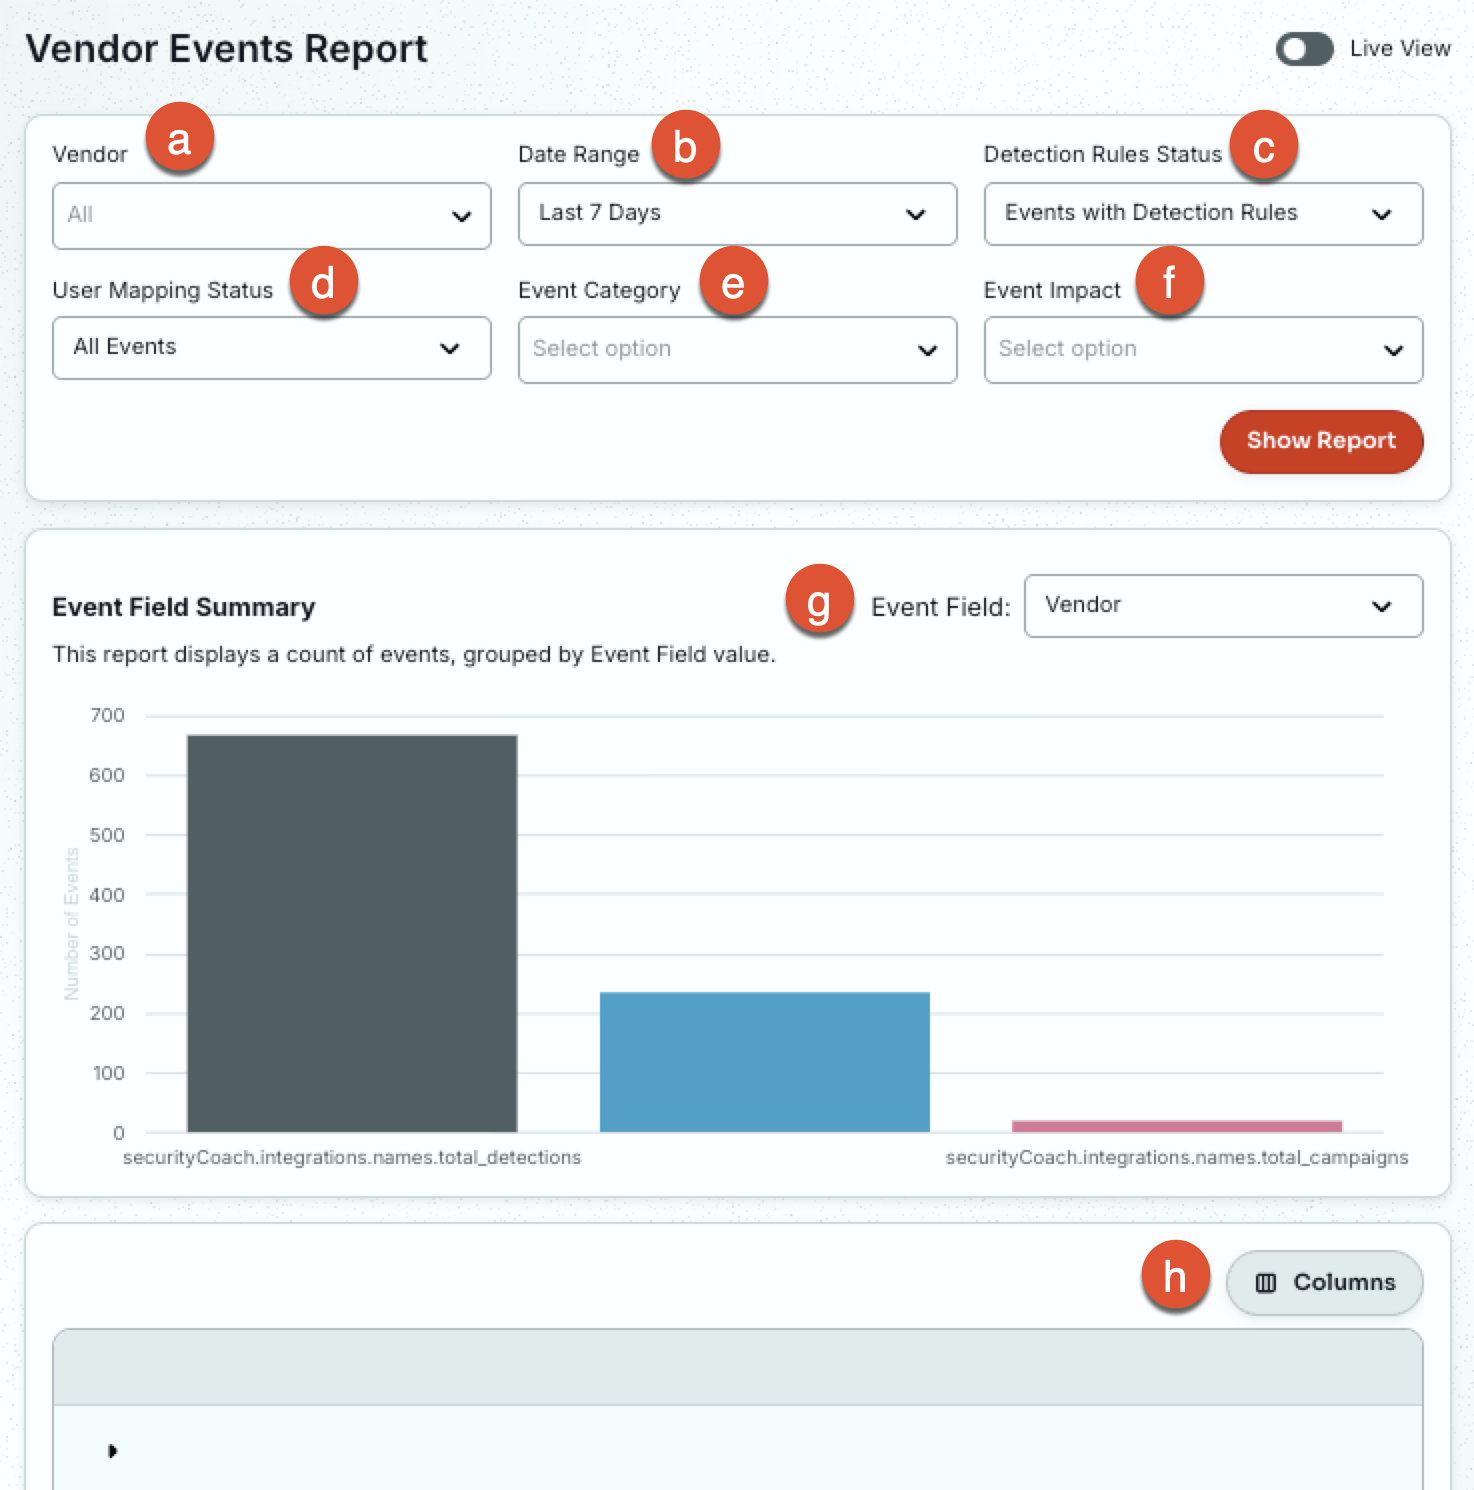
- Vendor: Select one or more vendors to display event data for.
- Date Range: Select the date range to display data for.
- Detection Rules Status: Display only Events with Detection Rules, or only Events without Detection Rules.
- User Mapping Status: Display All Events, only Events with User Mapping, or only Events without User Mapping.
- Event Category: Select one or more vendor event categories. Requires a vendor selection first.
- Event Impact: Select one or more vendor event impact levels. Requires a vendor selection first.
- Event Field: View data by Vendor, Event Type, Event Category, Event Impact, or Event Source.
- Show Report: Save your filters and generate the report data.
Once you apply your filters and generate the report, a table will display with information about each event. Use the Columns drop-down menu to select which columns to display, and select the arrow icon on any row for more details on that event.
The Live View toggle, located in the top-right corner of the page, lets you view the latest events detected by your integrated vendors. Filters are disabled in Live View, and events are displayed in chronological order.
Risk Report for Endpoint Security Vendors
The Risk Report for Endpoint Security Vendors provides an overview of events related to endpoint security. This report includes only events from your integrated vendors. To access this report, locate the Risk Overview for Vendor Type section and select Endpoint Security Vendors. See our Real-Time Coaching Overview and Vendor Security Types article to learn more about integrating endpoint security vendors.
For more information on this report, see the following screenshot and list:
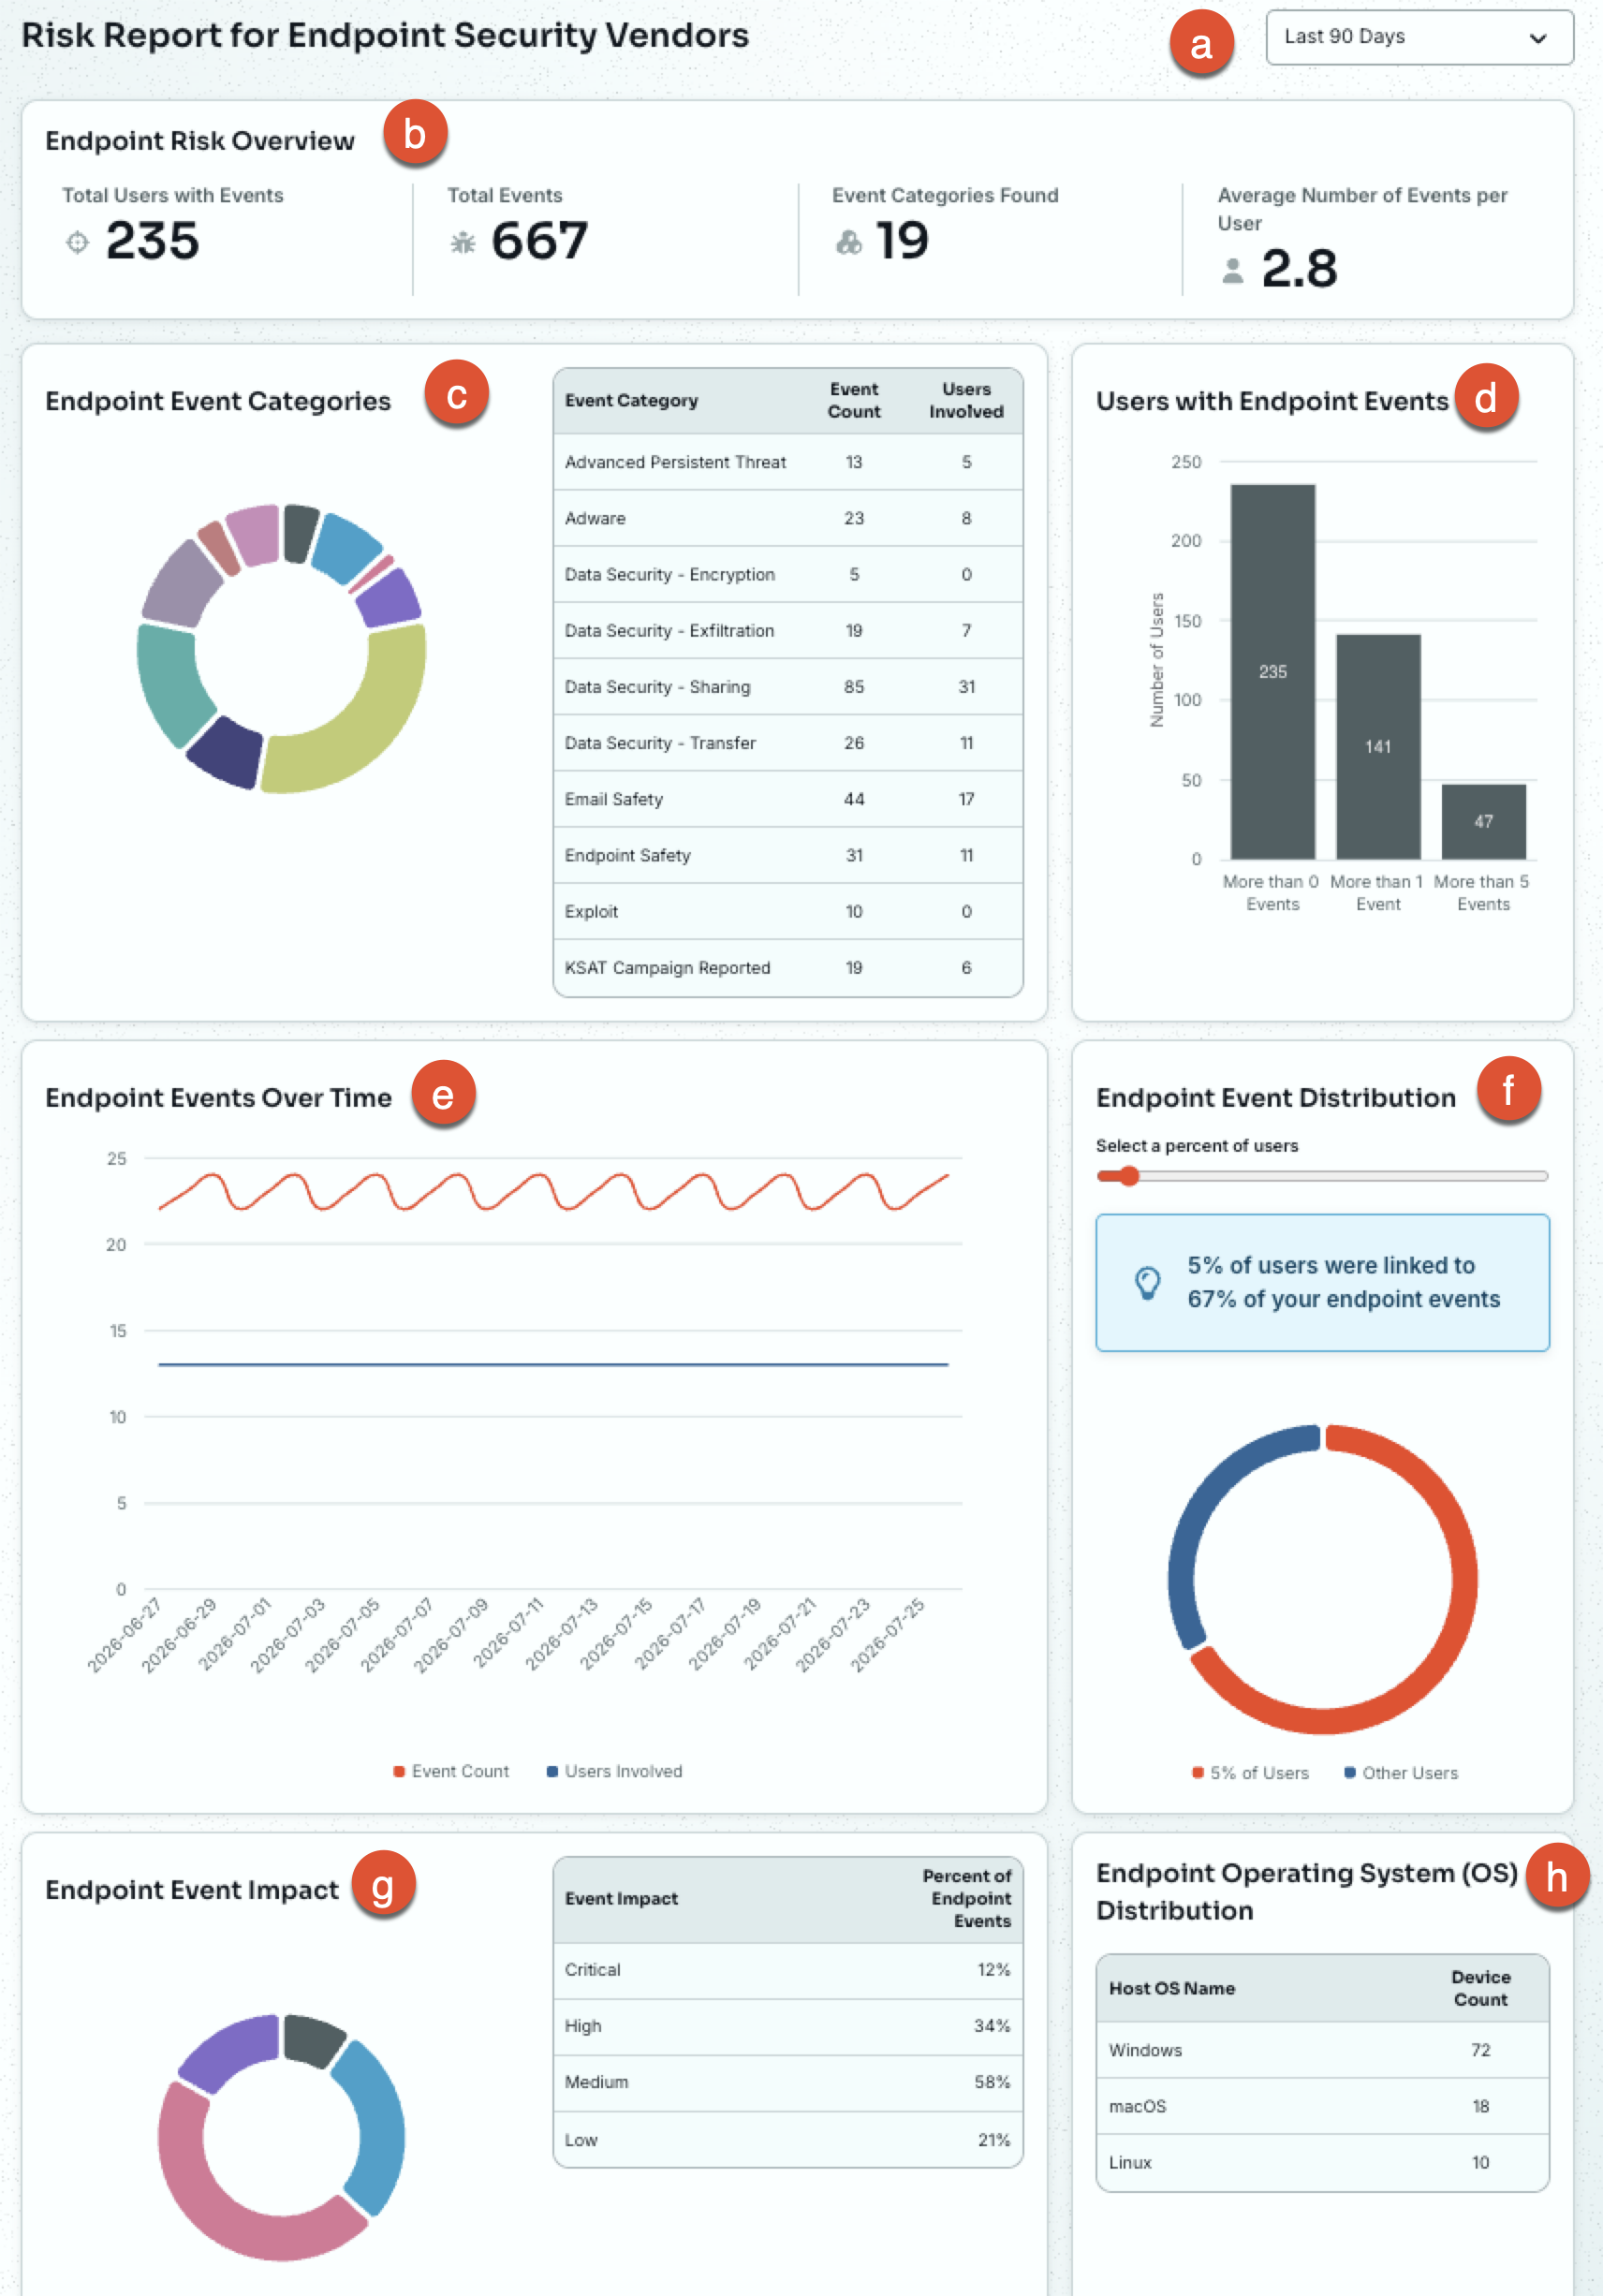
- Time Range Filter: Adjust the time range to show reporting data for. By default, this report displays data and activity from the last 90 days.
-
Endpoint Risk Overview: This section summarizes your organization's endpoint security events.
- Total Users with Events: The number of users with at least one endpoint event during the selected date range.
- Total Events: The total number of endpoint events during the selected date range.
- Event Categories Found: The number of distinct event categories detected among the endpoint events.
- Average Number of Events per User: The average number of endpoint events per user.
- Endpoint Event Categories: This chart and table break down your endpoint events by category, with the event count and number of users involved for each.
- Users with Endpoint Events: This graph shows how many users had more than zero, more than one, or more than five endpoint events during the selected date range. Use it to spot users with repeated risky activity.
- Endpoint Events Over Time: This graph tracks the changes in endpoint events and users involved during the selected date range, so you can see how endpoint risk is trending.
- Endpoint Event Distribution: This chart shows the percentage of endpoint events tied to a selected percentage of your riskiest users. For example, selecting 5% shows how much of your organization's endpoint risk is concentrated in your riskiest five percent of users.
- Endpoint Event Impact: This chart breaks down your endpoint events by impact level, so you can gauge the overall severity of the activity detected. Levels include Critical, High, Medium, and Low.
- Endpoint Operating System (OS) Distribution: This table lists each operating system with an endpoint event and its device count, helping you identify which operating systems are generating the most risk.
Risk Report for Email Security Vendors
The Risk Report for Email Security Vendors provides an overview of events related to email security. This report includes only events from your integrated vendors. To access this report, locate the Risk Overview for Vendor Type section and select Email Security Vendors. See our Real-Time Coaching Overview and Vendor Security Types articles to learn more about integrating email security vendors.
For more information on this report, see the following screenshot and list:
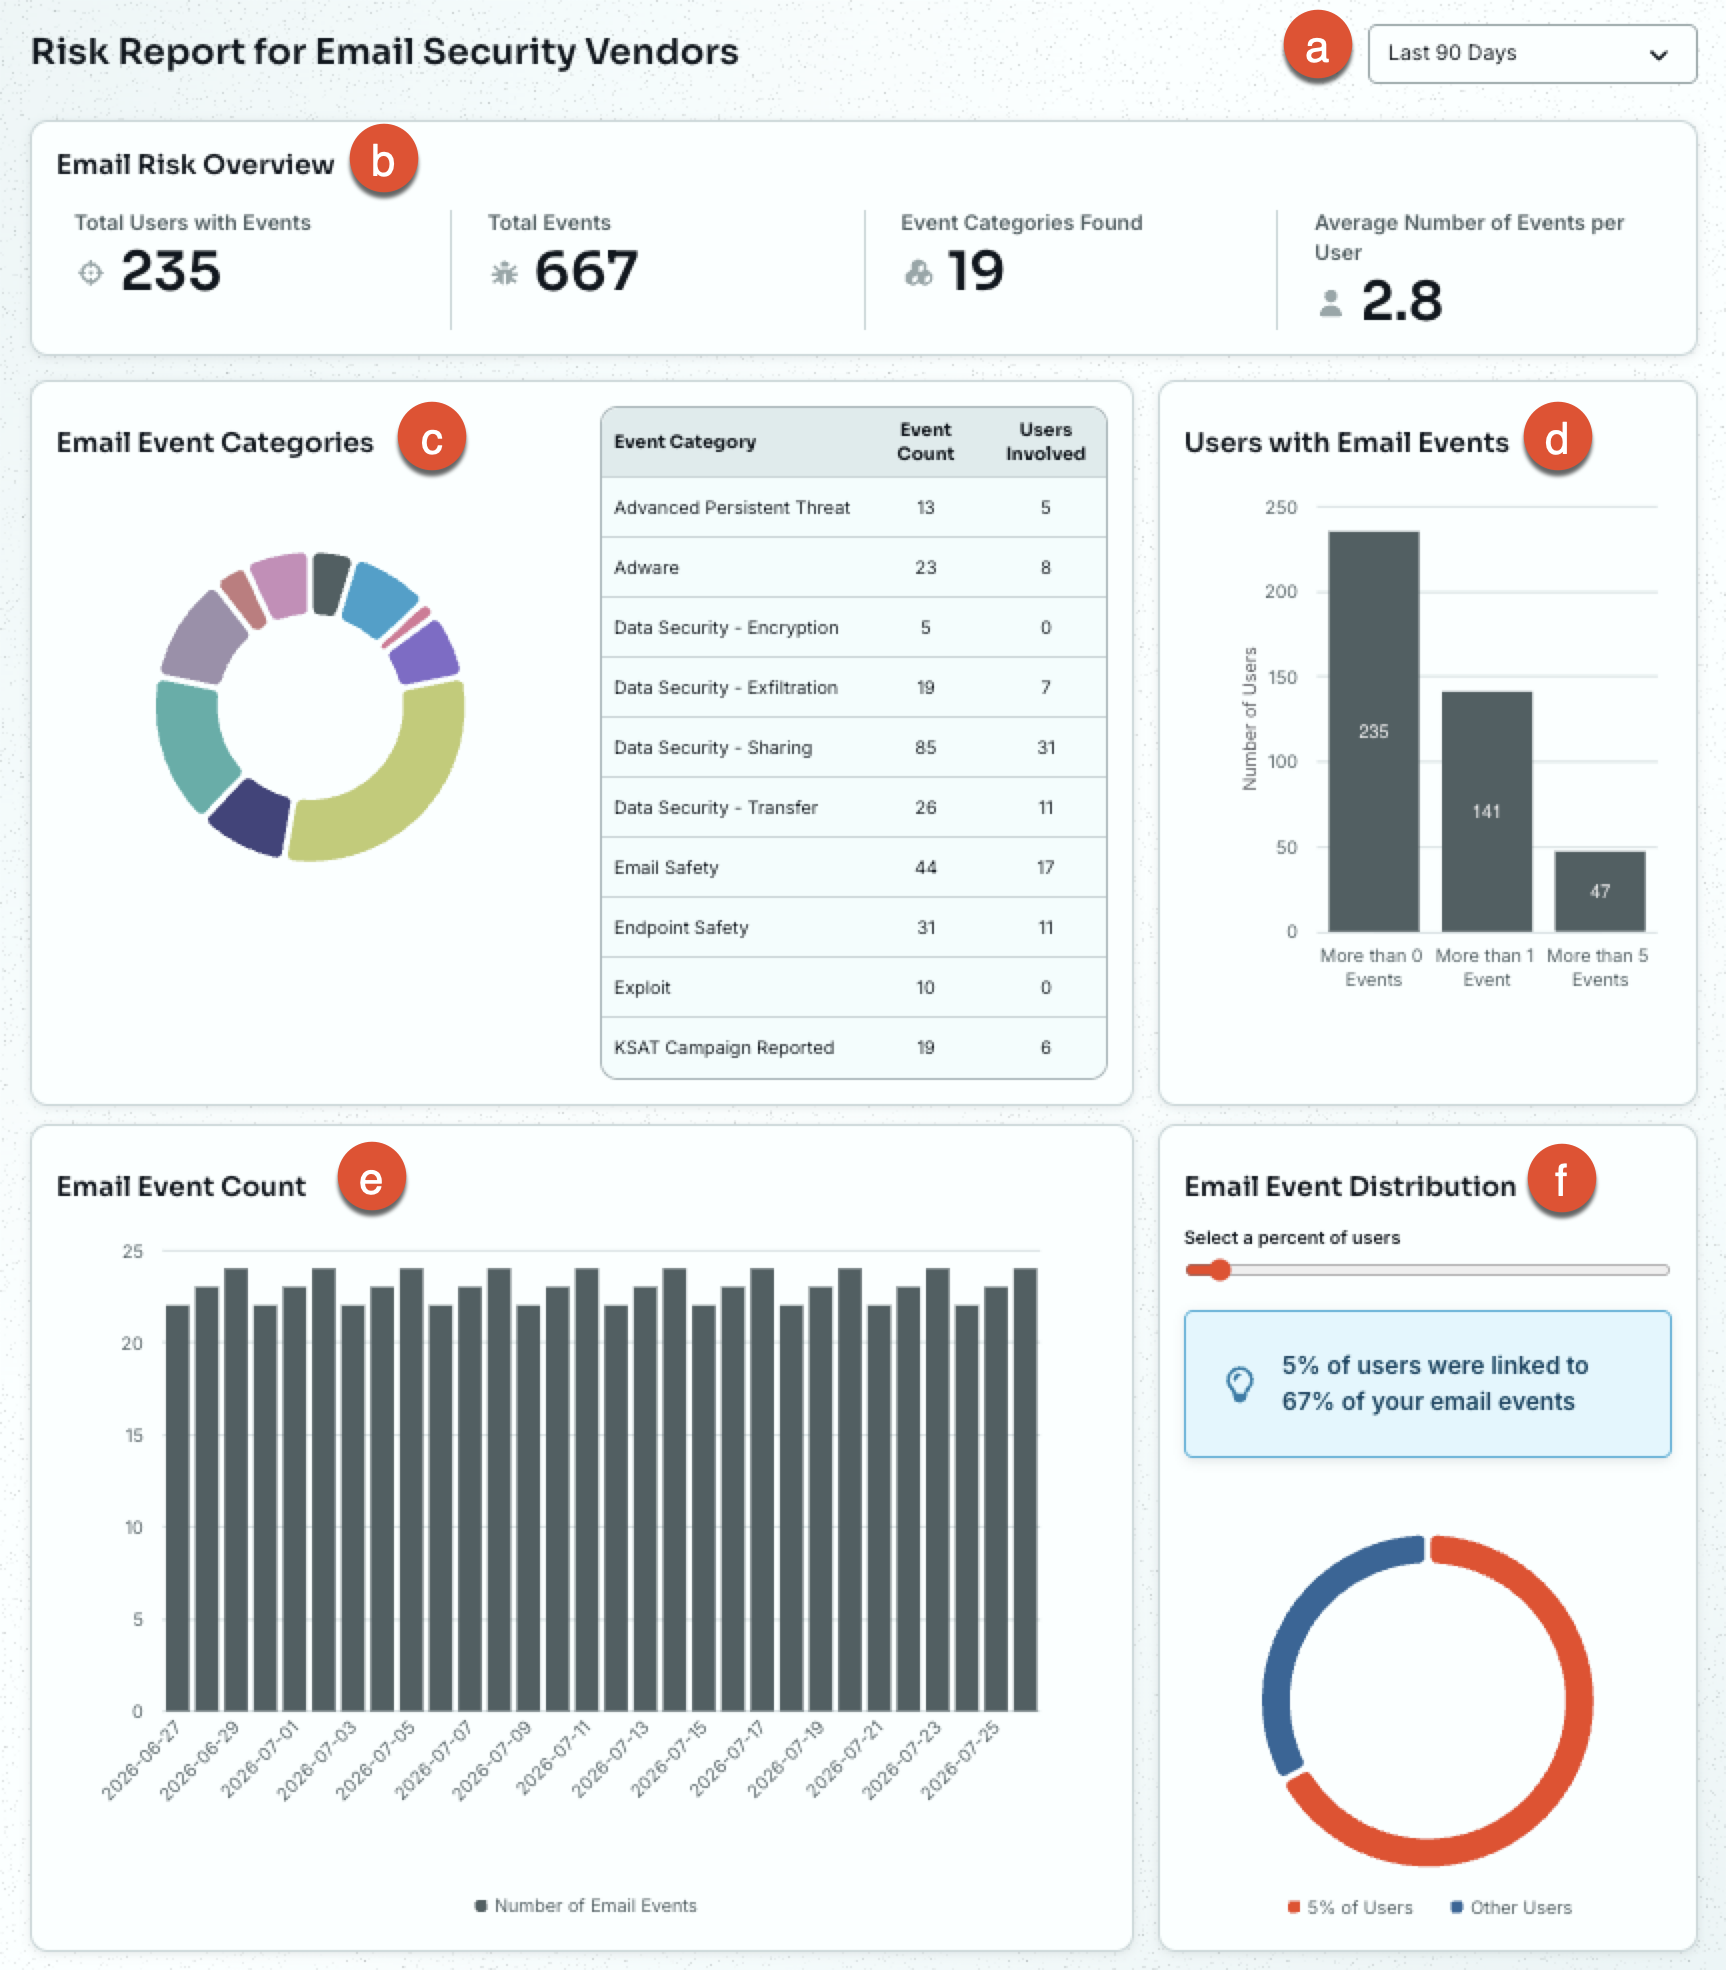
- Time Range Filter: Adjust the time range to show reporting data for. By default, this report displays data and activity from the last 90 days.
-
Email Risk Overview: This section summarizes your organization's email security events.
- Total Users with Events: The number of users with at least one email event during the selected date range.
- Total Events: The total number of email events during the selected date range.
- Event Categories Found: The number of distinct event categories detected among your email events.
- Average Number of Events per User: The average number of email events per user.
- Email Event Categories: This chart and table break down your email events by category, with the event count and number of users involved for each.
- Users with Email Events: This graph shows how many users had more than zero, more than one, or more than five email events during the selected date range. Use it to spot users with repeated risky activity.
- Email Event Count: This graph shows the number of email events detected each day during the selected date range, so you can see how email risk is trending.
- Email Event Distribution: This chart shows the percentage of email events tied to a selected percentage of your riskiest users. For example, selecting 5% shows how much of your organization's email risk is concentrated in your riskiest five percent of users.
Risk Report for Web Security Vendors
The Risk Report for Web Security Vendors provides an overview of events related to web security. This report includes only events from your integrated vendors. To access this report, find the Risk Overview for Vendor Type section and select Web Security Vendors. See our SecurityCoach Product Manual and Vendor Security Types article to learn more about integrating web security vendors.
For more information on this report, see the following screenshot and list:
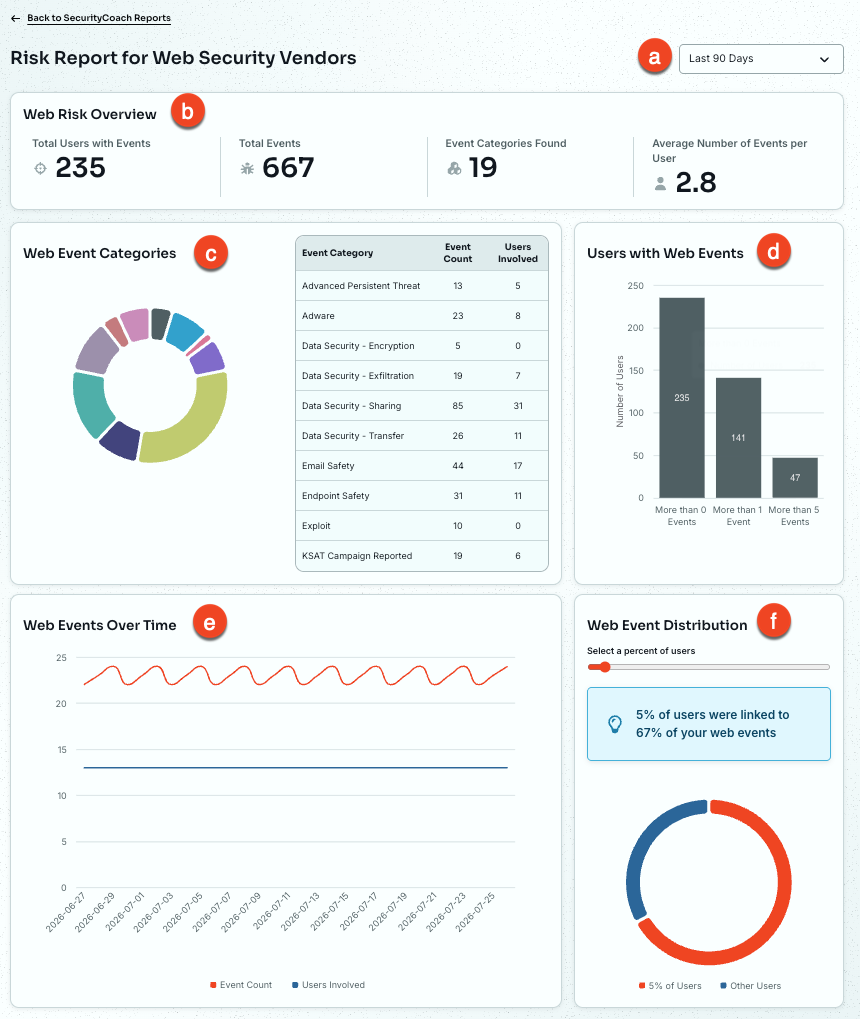
- Time Range Filter: Adjust the time range to show reporting data for. By default, this report displays data and activity from the last 90 days.
-
Web Risk Overview: This section summarizes your organization's web security events.
- Total Users with Events: The number of users with at least one web event during the selected date range.
- Total Events: The total number of web events during the selected date range.
- Event Categories Found: The number of distinct event categories detected among your web events.
- Average Number of Events per User: The average number of web events per user with at least one event.
- Web Event Categories: This chart and table break down your web events by category, with the event count and number of users involved for each.
- Users with Web Events: This graph shows how many users had more than zero, more than one, or more than five web events during the selected date range. Use it to spot users with repeated risky activity.
- Web Events Over Time: This graph tracks the changes in web events and users involved during the selected date range, so you can see whether web risk is trending up or down.
- Web Event Distribution: This chart shows the percentage of web events tied to a selected percentage of your riskiest users. For example, selecting 5% shows how much of your organization's web risk is concentrated in your riskiest five percent of users.