From the Reports tab of your KnowBe4 account, you can view your Risk Score Activity report to monitor your organization's Risk Score-related data. The Risk Score Activity report allows you to view more details about your Risk Score.
Customizing Risk Score Activity Reports
When you create a Risk Score Activity report, you can apply filters to the report to view specific data. To learn about the filters you can apply, see the screenshot and list below:
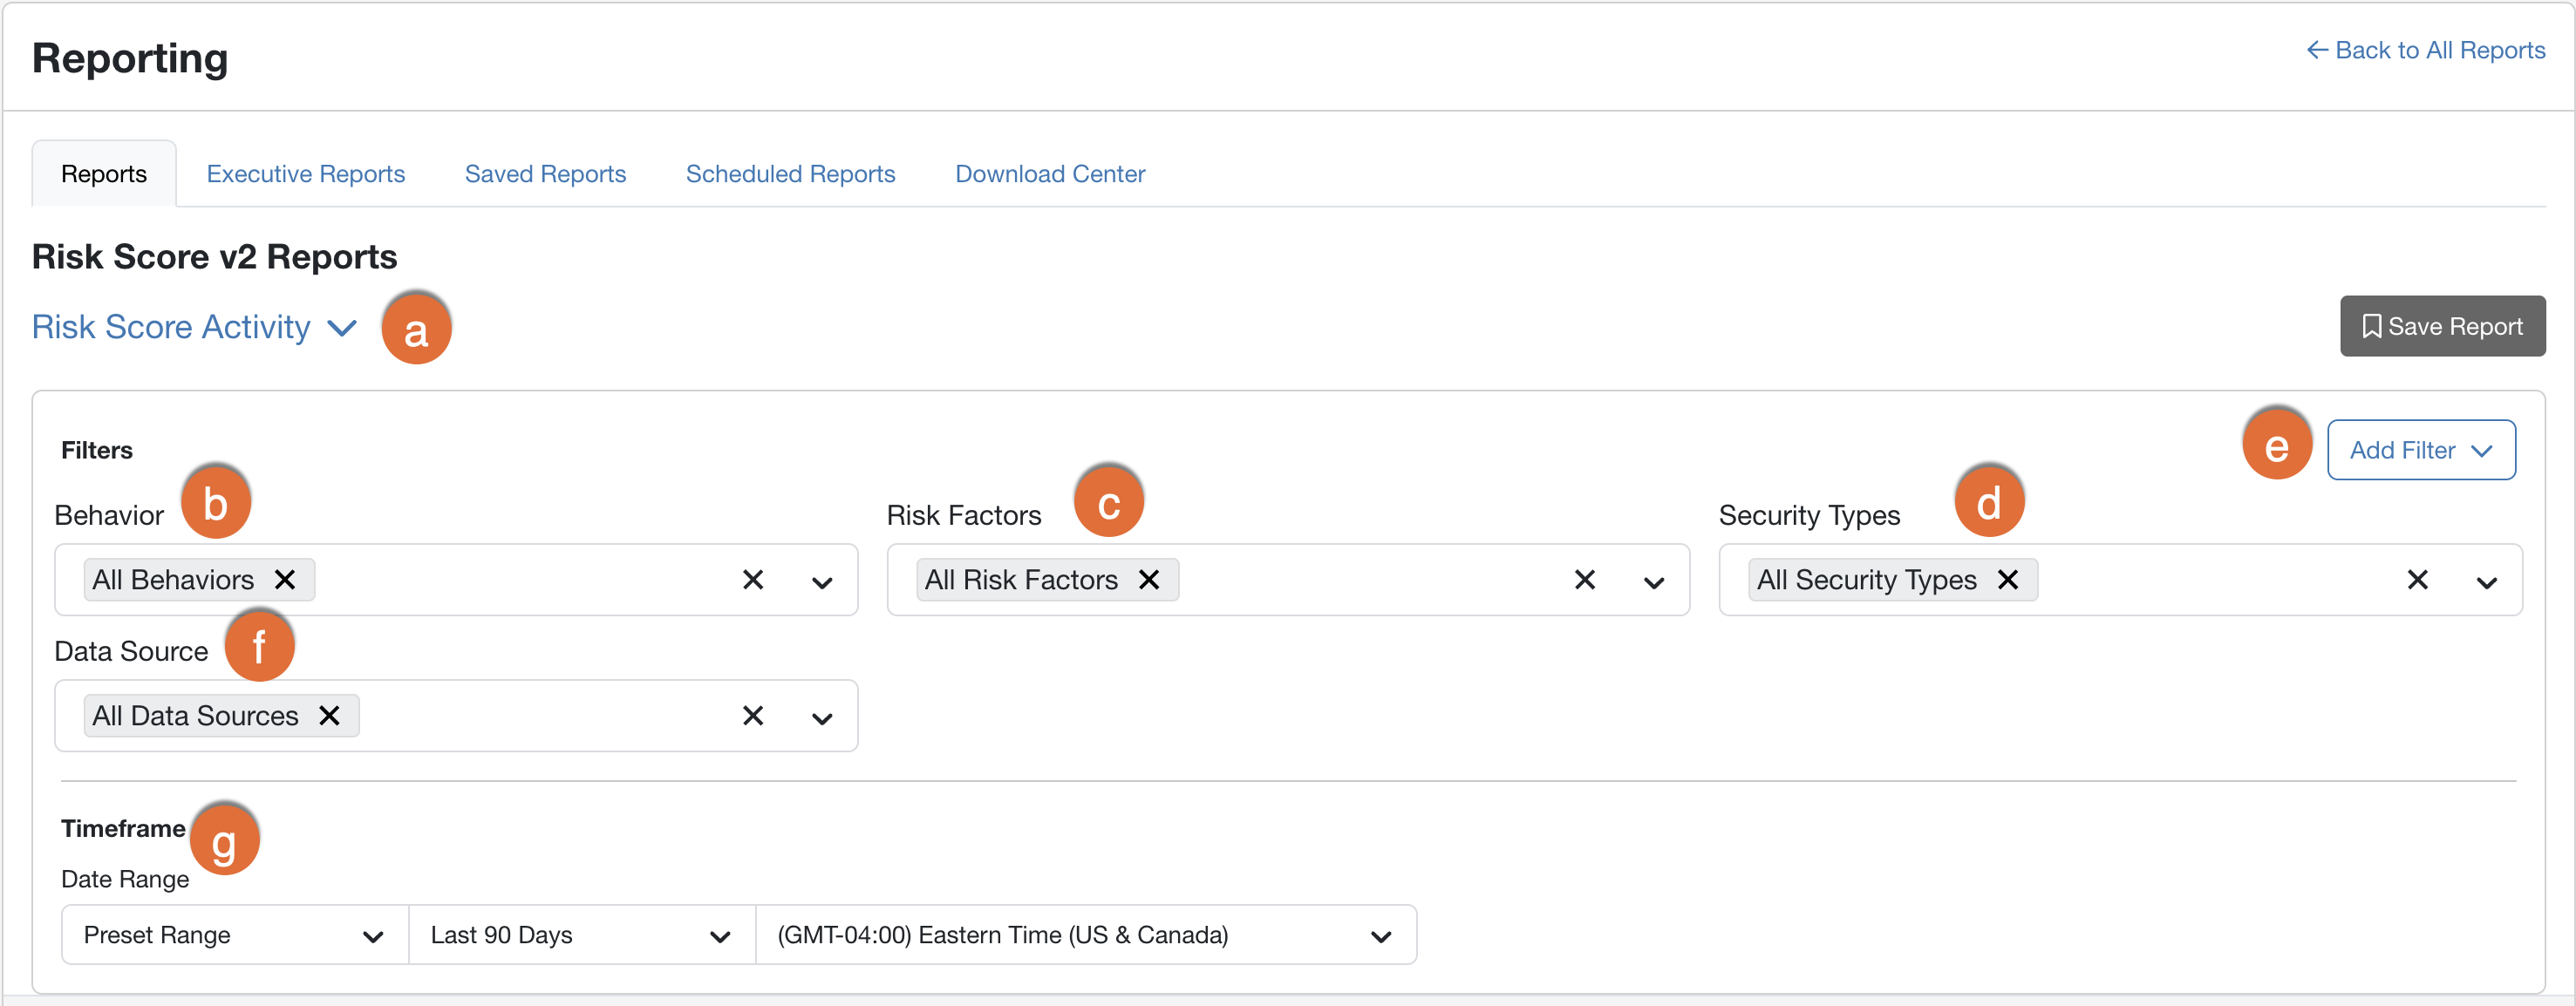
- Risk Score Activity: Use this drop-down menu to select your Risk Score report type. For more information about Risk Score Reports, see our SmartRisk Agent™ and Risk Score Guide.
- Behavior: Use this filter to select the behavior types to display.
- Risk Factors: Use this filter to select the risk factors to display.
- Security Types: Use this filter to select the security types to display.
-
Add Filter: You can customize your Risk Score Activity report with the following additional filters.
- User Groups: Use this filter to select the user groups to display.
- Exclude User Groups: Use this filter to select the user groups that you would like to exclude from the report. If a user is included in both the User Groups filter and the Exclude User Groups filter, the user will be excluded from the report.
- Search User: Use this filter to search for a specific user’s data to display.
-
Data Source: Use this filter to select the data sources for display.
Note:In this report, events influenced by the User Event API are sourced as API. - Timeframe: Use this filter to select the date range to display. This date range is based on when the events or behaviors occurred.
After you select your filters, click the Apply Changes button.
Viewing Risk Score Activity Reports
After you customize your Risk Score Activity report, your report will display a table that you can further customize to display and sort your results. To learn how to customize the table, see the screenshot and list below:
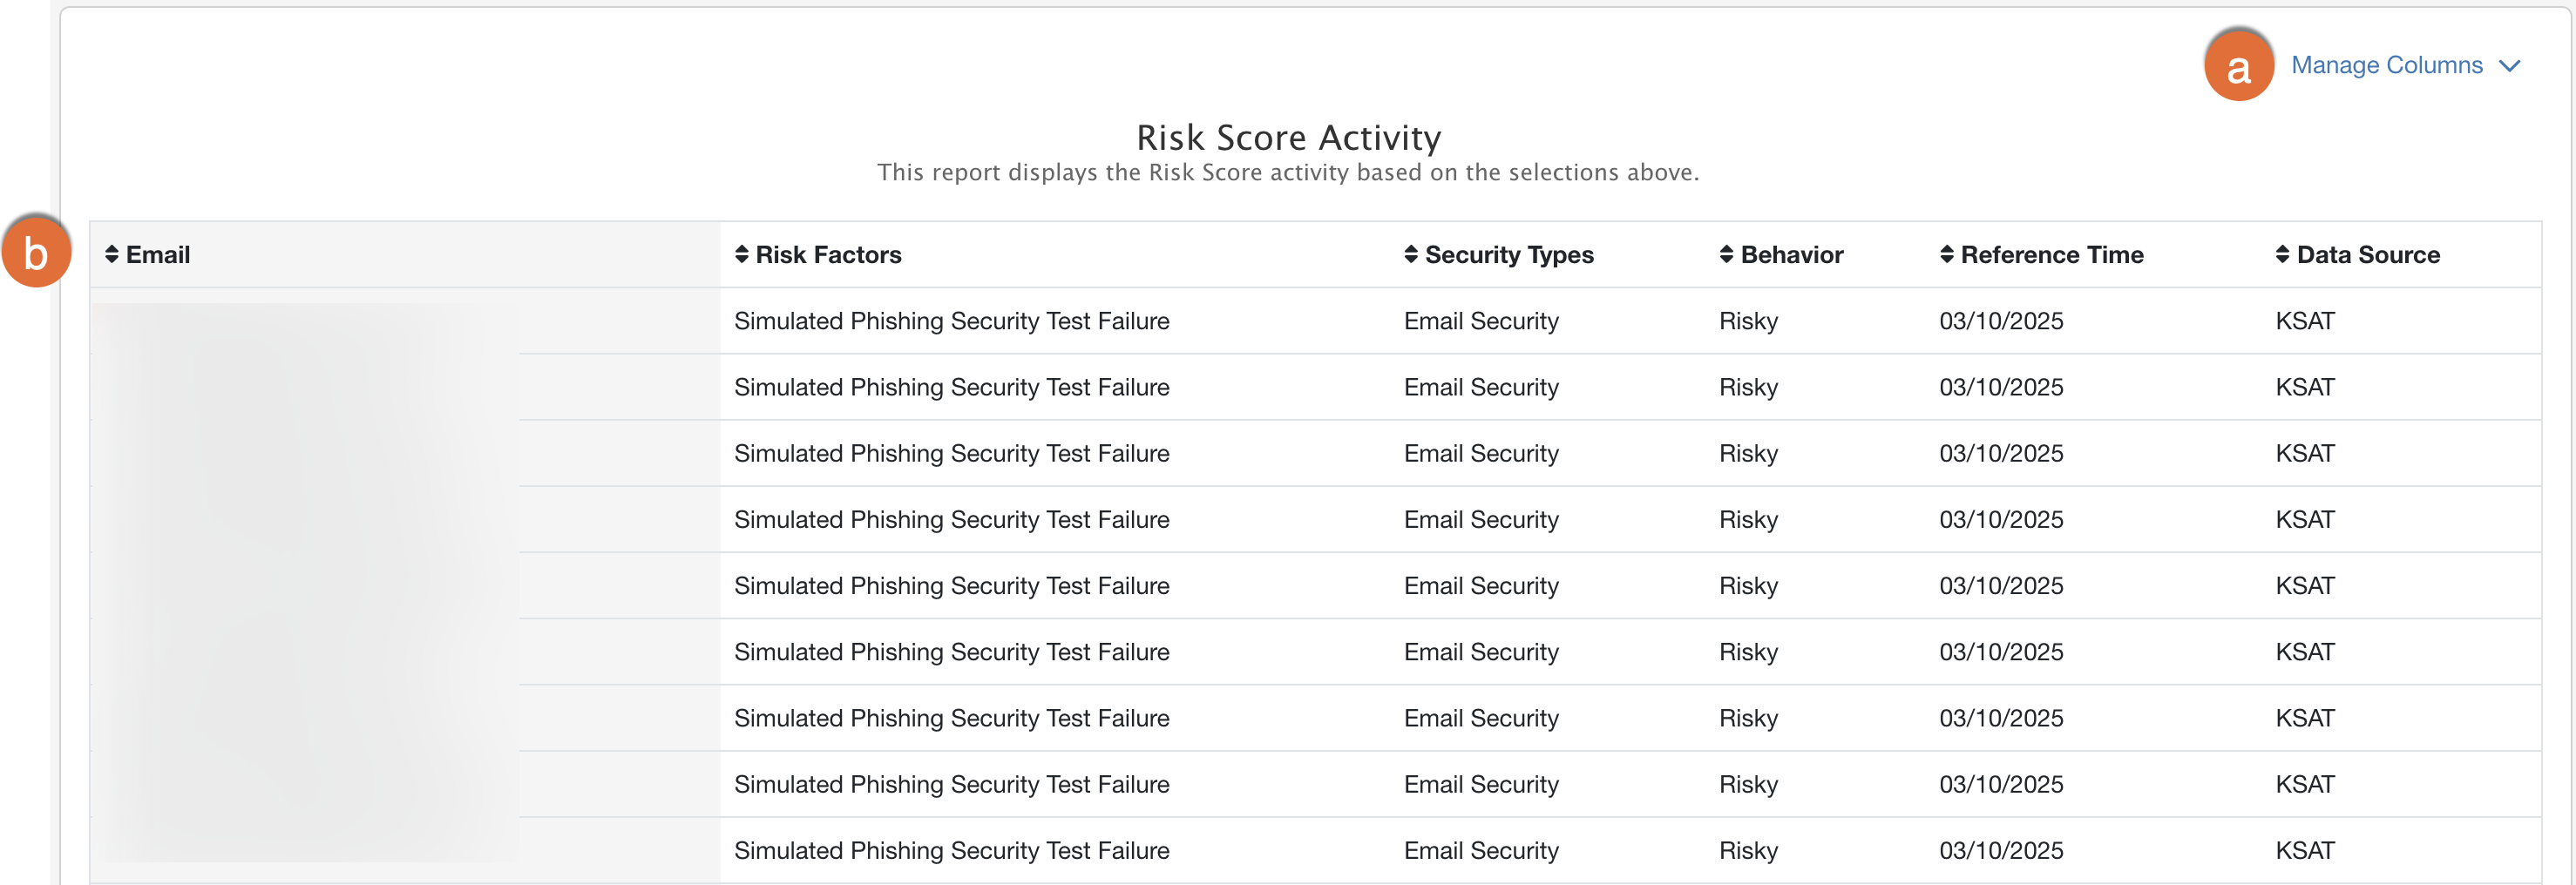
-
Manage Columns: Click this text to display a drop-down menu that contains a list of available columns. From the drop-down menu, you can deselect the default columns and select additional columns to display in the table.
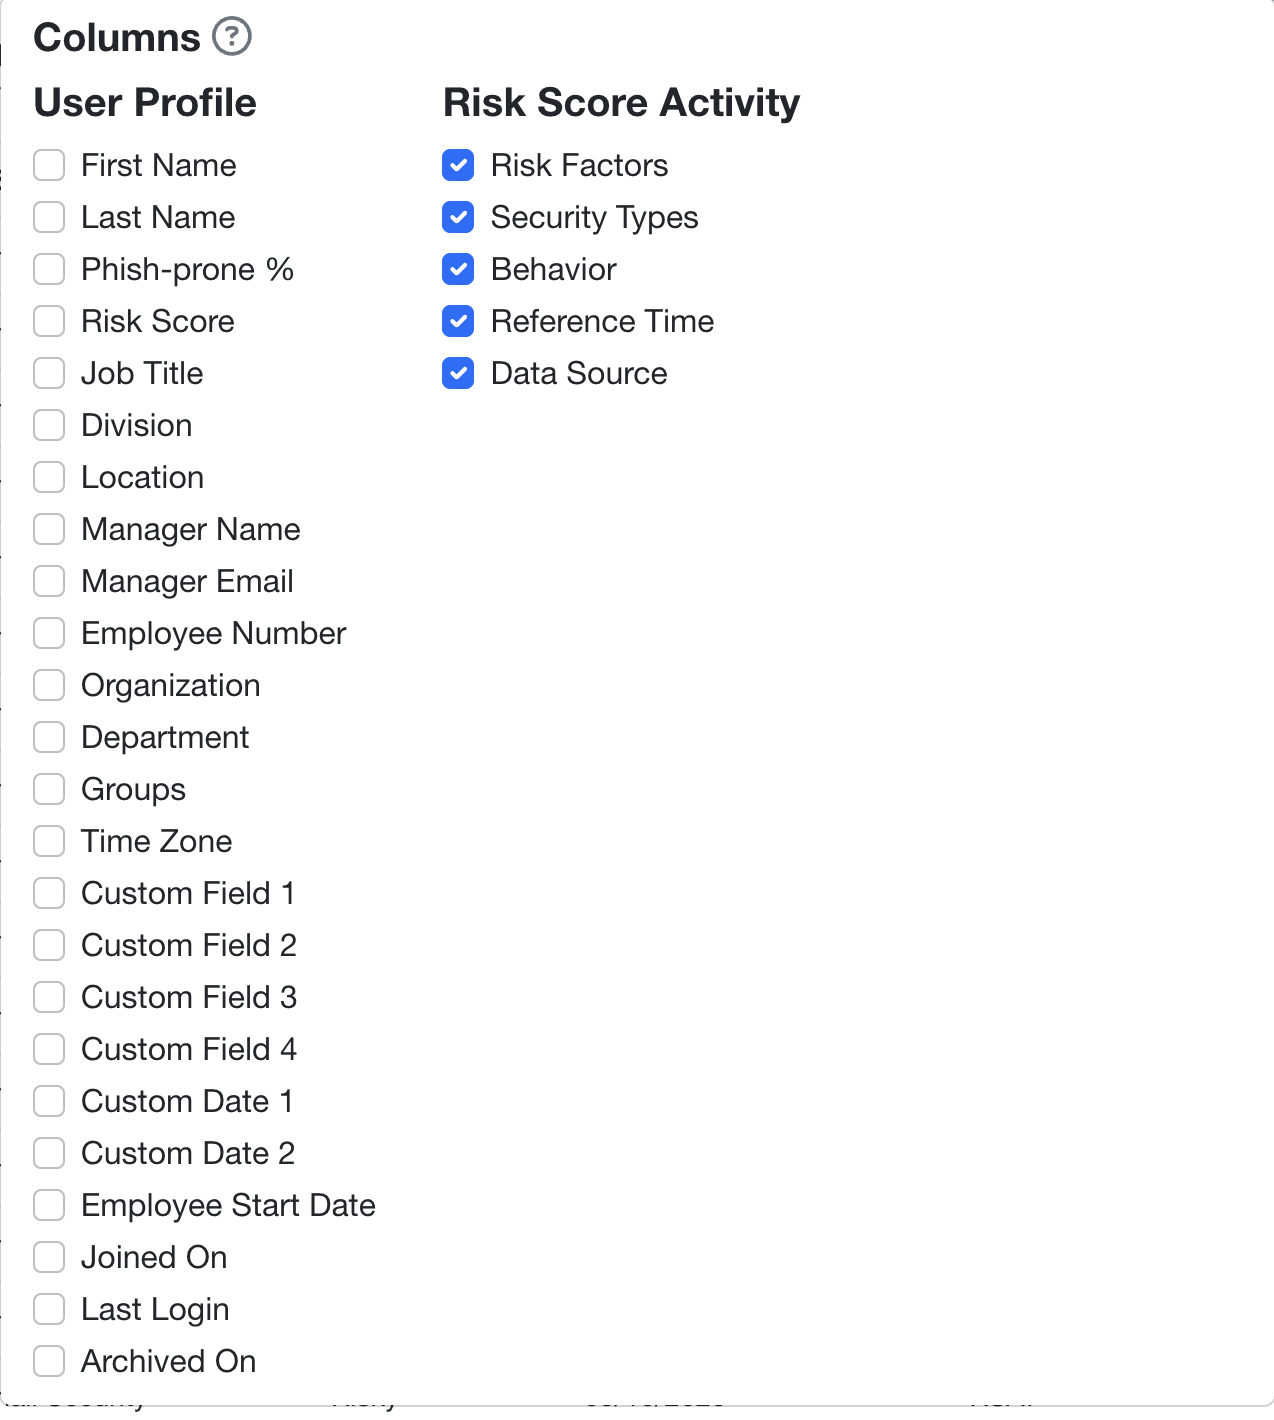 Note:If you export a CSV file of your report, the columns that you’ve selected from the drop-down menu will display in the CSV file. If you save your report by clicking Save Report, the columns you’ve selected will display in the saved report.
 - Arrow: Click this icon in the column headers to sort the results in the table.
Exporting Risk Score Activity Reports
If you would like to export your Risk Score Activity report, you can use the Export as button near the top-right corner of the filter options to generate a CSV file.
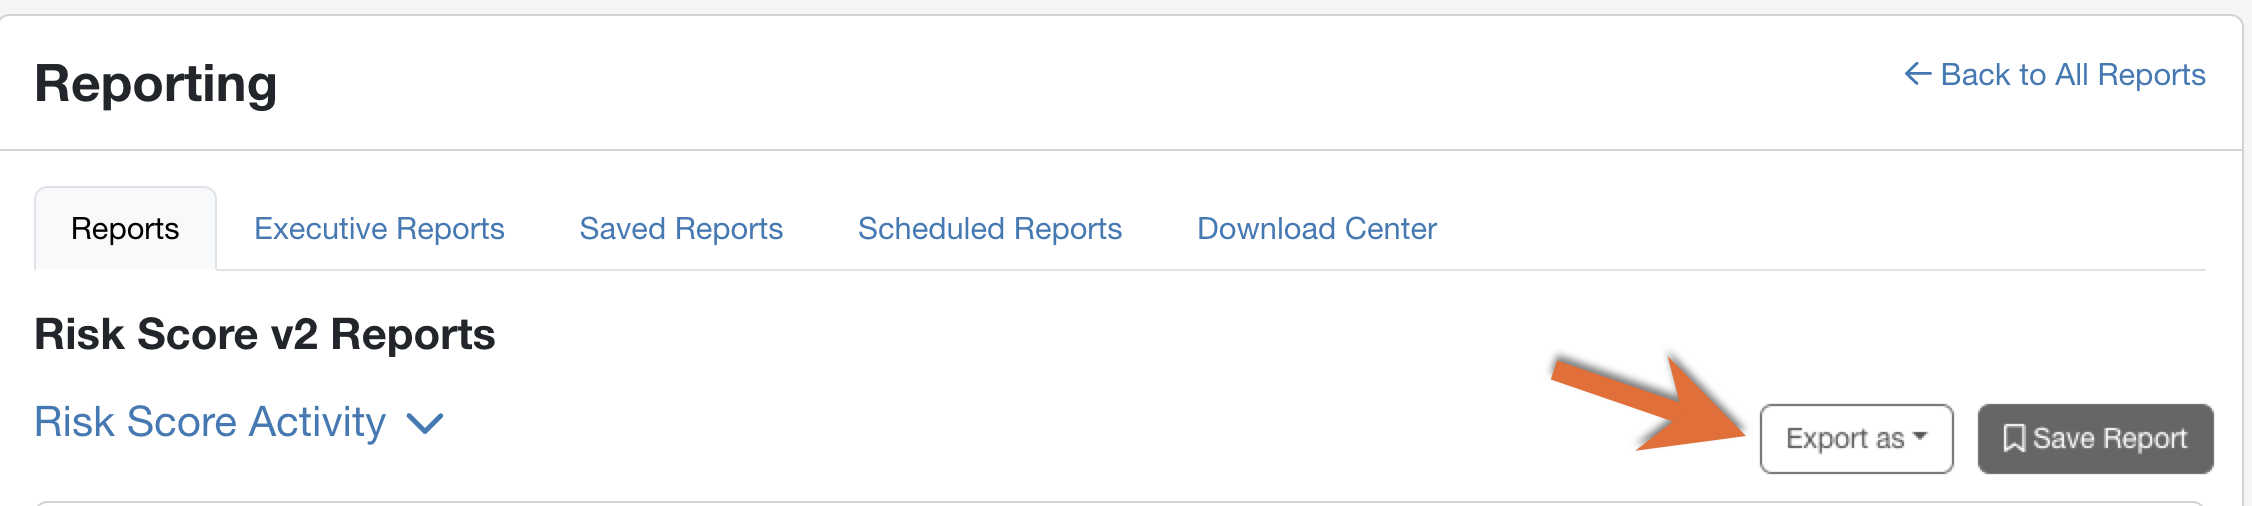
This action will open a drop-down menu where you can choose to Generate CSV for a CSV file version of the report table.
In the top-right corner of your console, a notification bell icon will display when your generated report is ready to be downloaded. Your generated reports can also be downloaded at any time from the Download Center subtab. For more information, see the Download Center Overview article.