Prevent analytics allows admins to access top-level statistics and data for their organization. This feature lets admins explore these data points to examine an overview of each email event.
Dashboard Data
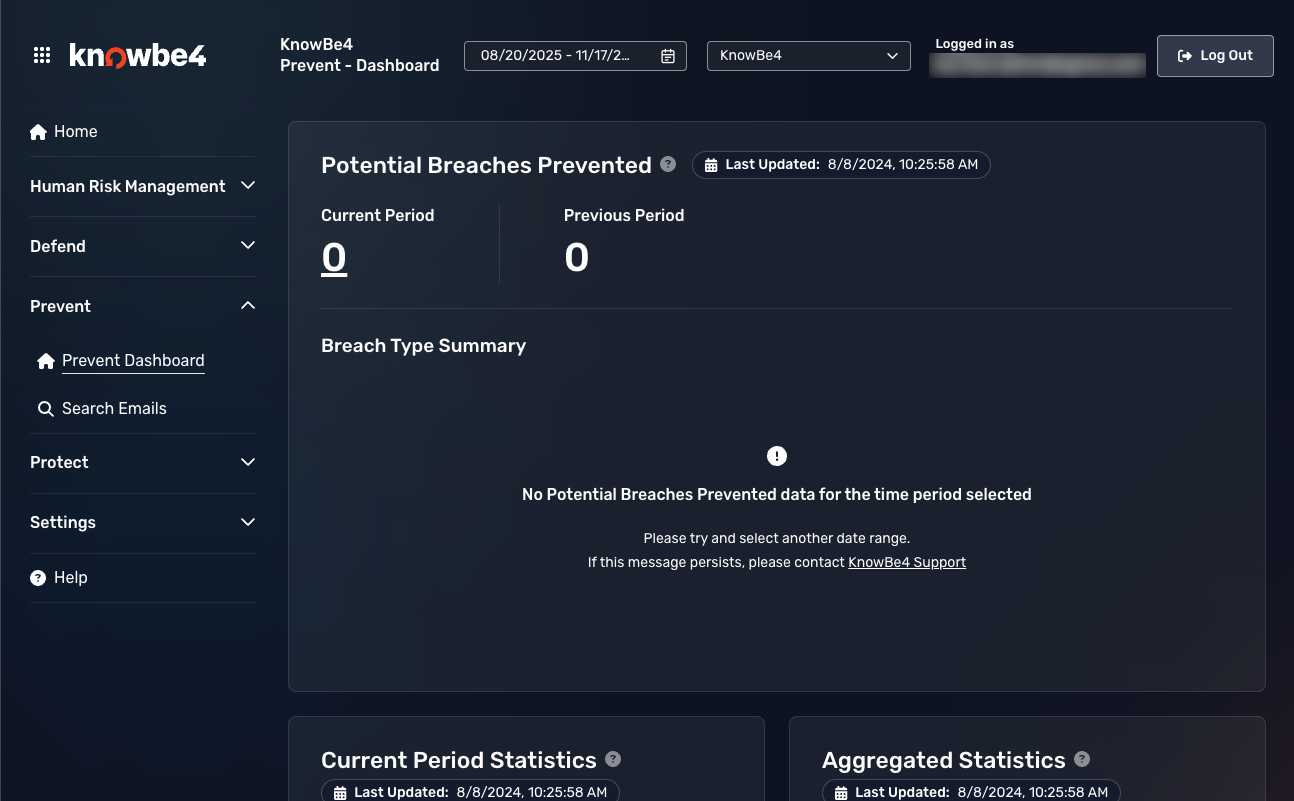
The Prevent dashboard displays an overview of every analyzed email, focusing on those emails where Prevent has driven end-users to change their behavior, whether updating, removing, or replacing recipients or sensitive content. The dashboard will link to a search emails page and apply relevant filters based on what you select, allowing you to conduct a more granular analysis.
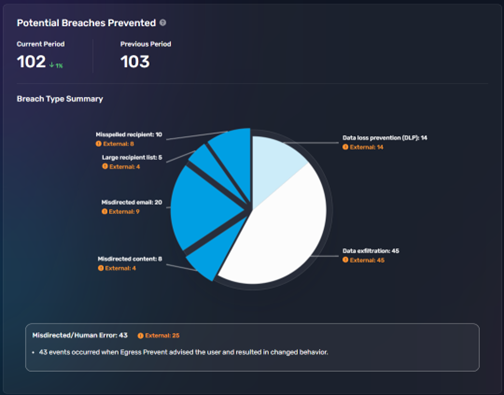
The data displayed on the initial dashboard aggregates the key Prevent use cases presented in the security center. The pie chart summarizes breach types, including:
- Aggregated potential breaches prevented, and a percentage increase or decrease indicator
- Aggregated potential breaches prevented for the preceding date period for comparison
- Misdirected emails prevented by users accepting Prevent advice
- Misspelled emails prevented by users accepting Prevent advice
- Data exfiltration emails prevented by users accepting Prevent advice
- Large recipient emails prevented by users accepting Prevent advice
- Data loss events (DLP) prevented by users accepting Prevent advice
- Misdirected content, including content analysis, events prevented by users accepting Prevent advice
- New recipient emails prevented by users accepting Prevent advice
- No or partial TLS emails prevented by users accepting Prevent advice
- Multi-domain emails prevented by users accepting Prevent advice
Potential Breaches Prevented
This chart displays the number of potential breach events that contain at least one external recipient, allowing you to filter those emails easily. Clicking on any slice of the chart allows you to view a description of that statistic.
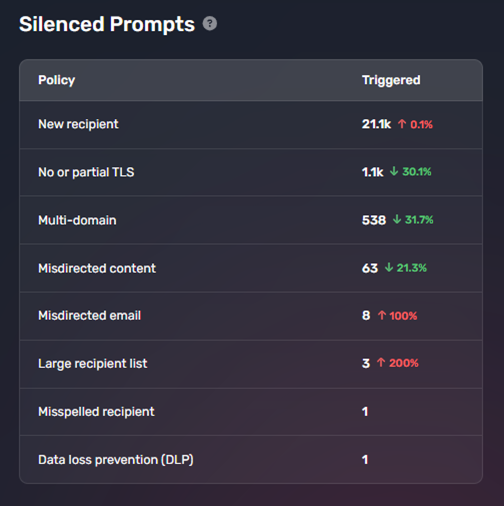
Silenced Prompts
This card displays the Prevent use cases you have chosen not to prompt users with Prevent advice about. These use cases are still being silently monitored. This feature can help you monitor the areas for which you may wish to configure prompting in the future.
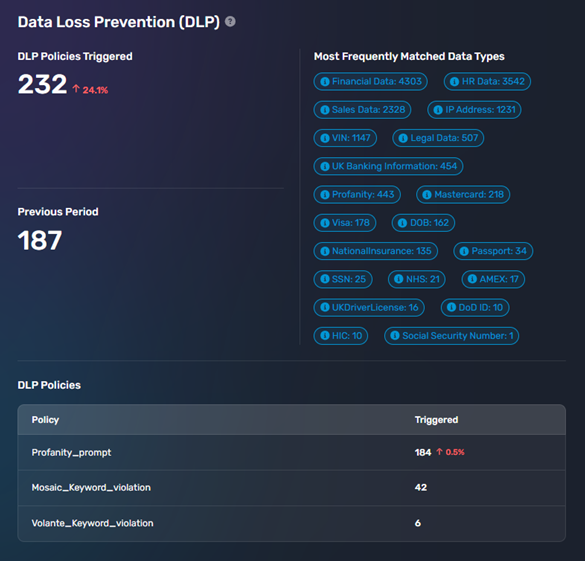
Data Loss Prevention (DLP)
This section displays a high-level overview of the statistics relating to any data matching for content analysis, misdirected content, or DLP policies your organization has configured can be viewed. The following data is displayed:
- Total number of DLP policies triggered for the given time period
- All data matches by type, identified during the given time period
- List of triggered DLP policies for the given time period
Clicking on any of these data points will take you to a filtered list of emails triggering those policies or matching those data types.
Date Filtering
The date drop-down menu in the top-right corner of the screen allows you to view data for the previous:
- Day
- Week
- Month
- Quarter
- Year
- Custom Range
Data Retention
The retention period for Prevent Analytics is 18 months, plus a rolling 30 days. This data is required to improve the accuracy of the Prevent services and provide trend and risk analysis for reporting.