KnowBe4’s Security Awareness Training (KSAT) console offers a wide range of reports that give insight into the effectiveness of your security awareness training program. Each available report in your console can be generated as either a CSV file or a PDF file, depending on the type of report.
Dashboard
The Dashboard tab of your console contains widgets for your organization’s Risk Score and phishing reports. These reports provide general information about your organization’s Phish-prone Percentage during the phishing campaign and your users’ actions during the campaigns. You can hover over the points in the graph to see more details on specific phishing campaigns, how many users each test was sent to, and your users’ actions.

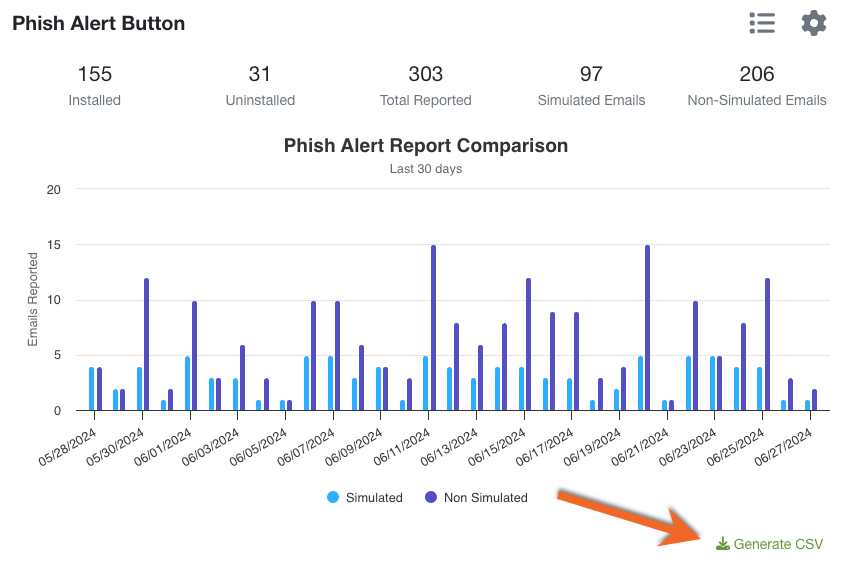
The Dashboard tab also contains a Phish Alert Button widget where you can generate a CSV report about the emails that your users report using the Phish Alert Button (PAB). This report includes information on the number of simulated and non-simulated emails that have been reported using the PAB, and it includes the number of times the PAB was installed and uninstalled. For more information, visit our Dashboard Overview.
To generate your PAB report from the widget, click the Generate CSV button at the bottom-right corner.
Phishing
The Phishing tab > Campaigns subtab contains useful reports to see when users completed an action on a phishing test. Clicking the phishing campaign name in the Campaigns subtab will lead you to the campaign’s page.
- If the phishing campaign is one-time, you can view the campaign’s report data by clicking on the Users subtab.
- If the phishing campaign is recurring, you can view report data from a single phishing campaign in the series by navigating to Phishing Security Tests, clicking on the Phishing Security Test (PST) name, and then clicking on the Users subtab.

Timestamps are available for the following actions:
- Delivered
- Opened
- Clicked
- QR Code Scanned
- Replied
- Attachment Opened
- Macro Enabled
- Data Entered
- Reported
- Bounced
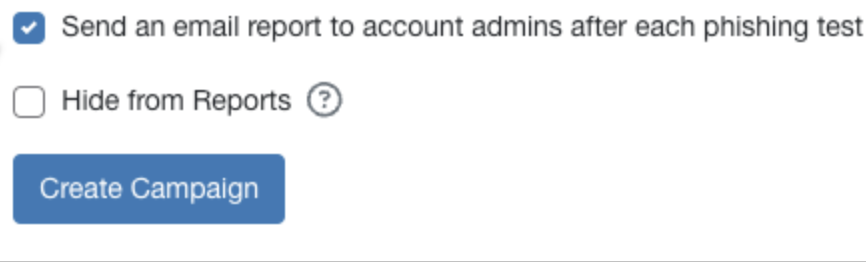
If you would like your account admin to receive an email report at the end of your PSTs, select the Send an email report to account admins after each phishing test check box when creating a new campaign.
The Phishing tab > Reports subtab also contains reports that are useful for totaling user actions on multiple campaigns. For example, you can use these reports to determine how many times each user clicked on a simulated phishing link.
Your report can be filtered by specific date range, specific campaigns, PhishFlip campaigns, and campaigns sent to certain users. You can also compare results by groups for phishing failures and phishing emails reported.
Once you have set the filters that you want to include in your report, click the Submit button to generate your new report. You can generate a CSV file of the table data using the Generate CSV button, or you can print the table data and graph using the Print Report button. For more information, see our Monitor and Review Overall Phishing Reports article.

Training
The Training tab > Campaigns subtab contains reports for specific training campaigns. Clicking the training campaign name in the Campaigns subtab will lead you to the campaign’s page. You can view the training campaign’s report data by clicking the Users subtab.
The report from the Users subtab will have the following information:
- All Users: The total number of users.
- Incomplete: The number of users that have not completed their training.
- Not Started: The number of users that have not started their training.
- In Progress: The number of users that have a training course in progress.
- Completed: The number of users that have completed their training.
- Past Due: The number of users that have past due training.
You can generate a CSV file version of the report by clicking the Generate CSV button at the bottom of the table.

The Training tab > Reports subtab contains the Sign-up Reports section, which includes a report for a list of users who have logged in at least once and a report for a list of users who have never logged in. Both reports can be generated as a CSV file.

In the Reports subtab, you can generate reports in the Content Reports section based on specific courses offered in the console. These reports can be filtered to include all users or specific groups, and they can have a certain start or end date. You also have the option of including archived users.
The reports generated in the Content Reports section can provide the following information about your users:
- Users Who Started the Selected Content: This report pulls a list of users who have started the selected content within the given date range.
- Users Who Have Not Started the Selected Content: This report pulls a list of users who were assigned the content within the given date range but have not yet started that content.
- Users Who Have Not Completed the Selected Content: This report pulls a list of users who started their content within the given date range but have not yet completed that content.
- Users Who Have Not Started the Selected Content or Are in Progress: This report pulls a list of users who were assigned the selected content within the given date range but have not started or finished that content.
- Users Who Have Completed the Selected Content: This report pulls a list of users who completed the selected content within the given date range.
- Users Who Acknowledged Course-Attached Policies: This report pulls a list of users who acknowledged their course-attached policies within the given date range.
- Users Who Did Not Acknowledge Their Course-Attached Policies: This report pulls a list of users who were assigned the selected content within the given date range but have not acknowledged their course-attached policies.

If you are looking for highly detailed information for a large number of campaigns, we recommend using our API feature. This feature will allow you to export all of the information in the console to an external platform, and that raw data can be combined in any way you wish. For more information on our API feature, see our Reporting API Overview.
Reporting
The Reports tab contains useful reports for capturing actionable metrics. These reports are useful for sharing with executives or stakeholders to show progress with your security awareness training.
This tab allows you to see reports based on the following categories:
- Training Activity Reports: These reports can help you analyze the completion status of the courses your users have been assigned to ensure that you are building a human firewall.
- Group and User Report Cards: These report cards can help you determine your group’s Risk Score, Phish-prone Percentage, top five clicked emails, and other helpful data about your group.
- Phishing Activity Reports: These reports can help you analyze your organization’s phishing activity by Phishing Security Tests (PSTs). You can also change the report type to group phishing activity by user.
- Risk Score Reports: These reports can help you determine how likely users, user groups, or locations are to fall for attacks.
- Phish-prone Percentage Reports: These reports can help you determine your user groups’ susceptibility to phishing attacks based on their Phish-prone Percentages.
- Training Status by Campaign: This report allows you to review whether each of your users has started training and how much time they spend on it.
- Failure Types Report: This report can help you discover the social engineering attack vectors your users are most susceptible to.
- Training Status Overview Reports: These reports can help you review the number of courses users are enrolled in and their current status, organized by campaign, course, or group.
- Phish-failure Percentage Reports: These reports can help you determine the likelihood of your user groups failing a phishing attack based on their Phish-failure Percentages.
- Phishing Results by User Count: This report allows you to discover how phish-prone your users and user groups are on a scale of 0 percent to 100 percent.
- Email Templates Sent Reports: These reports can help you identify what phishing email templates have been sent to your users and how they typically act when they receive that particular template. You can also learn how many phishing tests your users have received.
- Failures by Phishing Template Report: This report can help you find out how many failures each of your phishing test templates has received and what these failures are.
- Security Awareness Proficiency Assessment Reports: These reports allow you to see the results of your organization's Security Awareness Proficiency Assessment (SAPA).
- Unphished and Untrained User Reports: These reports allow you to find out if your users are actively participating in their training program or what users may still need to be phished or enrolled in training.
- User Count and Login Reports: These reports allow you to find out how many active users you have in the KSAT console and review the number of users who have been added or removed.
- Security Culture Survey Reports: These reports allow you to see the results of your organization's Security Culture Survey (SCS).
- Training Hours Report: This report allows you to see how many hours your users spend on training.
- Training Comparison Reports: These reports can help you to find out if your training is lowering your Phish-prone Percentage and Risk Score.
- Detection Rules Activity Reports: These reports can help you analyze your organization’s detection rules activity in SecuirtyCoach.
- Real-Time Coaching Activity Reports: These reports can help you analyze your organization’s real-time coaching activity in SecurityCoach.
- Learner Platform Reports: These reports can help you analyze your organization’s percentage of training by platform.
- Training Content Survey: This report allows you to view your users’ training survey results to determine which training content is most effective. This data can also help you select training content for your campaigns.
These reports can be generated as PDF files or CSV files. For more detailed information on all of the available reports in the Reports tab, read our Reporting Guide.
If additional details are needed, such as individual user performance on campaigns, we recommend using one of the other types of reports mentioned in this article.
Smart Groups
If you have a Platinum, Diamond, SAT Foundation, or SAT Advanced subscription, you can create additional customized reports via our Smart Groups feature. These reports will include information about your users, such as their Phish-prone Percentage and Risk Score.
For example, a CSV file can be downloaded that displays which users meet the following Smart Group criteria:
"The user must have been created in the last 1 month" or "The user must not have been created prior to the last 12 months".
Smart Group reports can be created using specific criteria. These specific criteria can be filtered down further to include customized information about your organization's security awareness training. Examples of search criteria are listed below:
- User Field
- Custom Event
- User Date
- Phish Event
- PhishFlip Event
- Breach Event
- Training
- After Training
- Organizational Assessments
- PasswordIQ Event
- PasswordIQ State
- SecurityCoach Detection Rules
- SecurityCoach Real-Time Coaching

More detailed information can be found in our Smart Groups Quickstart Guide and Smart Groups Phishing Automation Guide article.