Team Dashboards are designed for managers to view information about their team, such as their team's training progress, phishing results, and Team Risk Score. If your organization has enabled Team Dashboards and you lead a team, you can view your Team Dashboard on the Dashboard tab of your Learner Experience. For more information, view our Team Dashboard Overview for Managers video.
For more information about the Team Dashboard, click the tabs below:
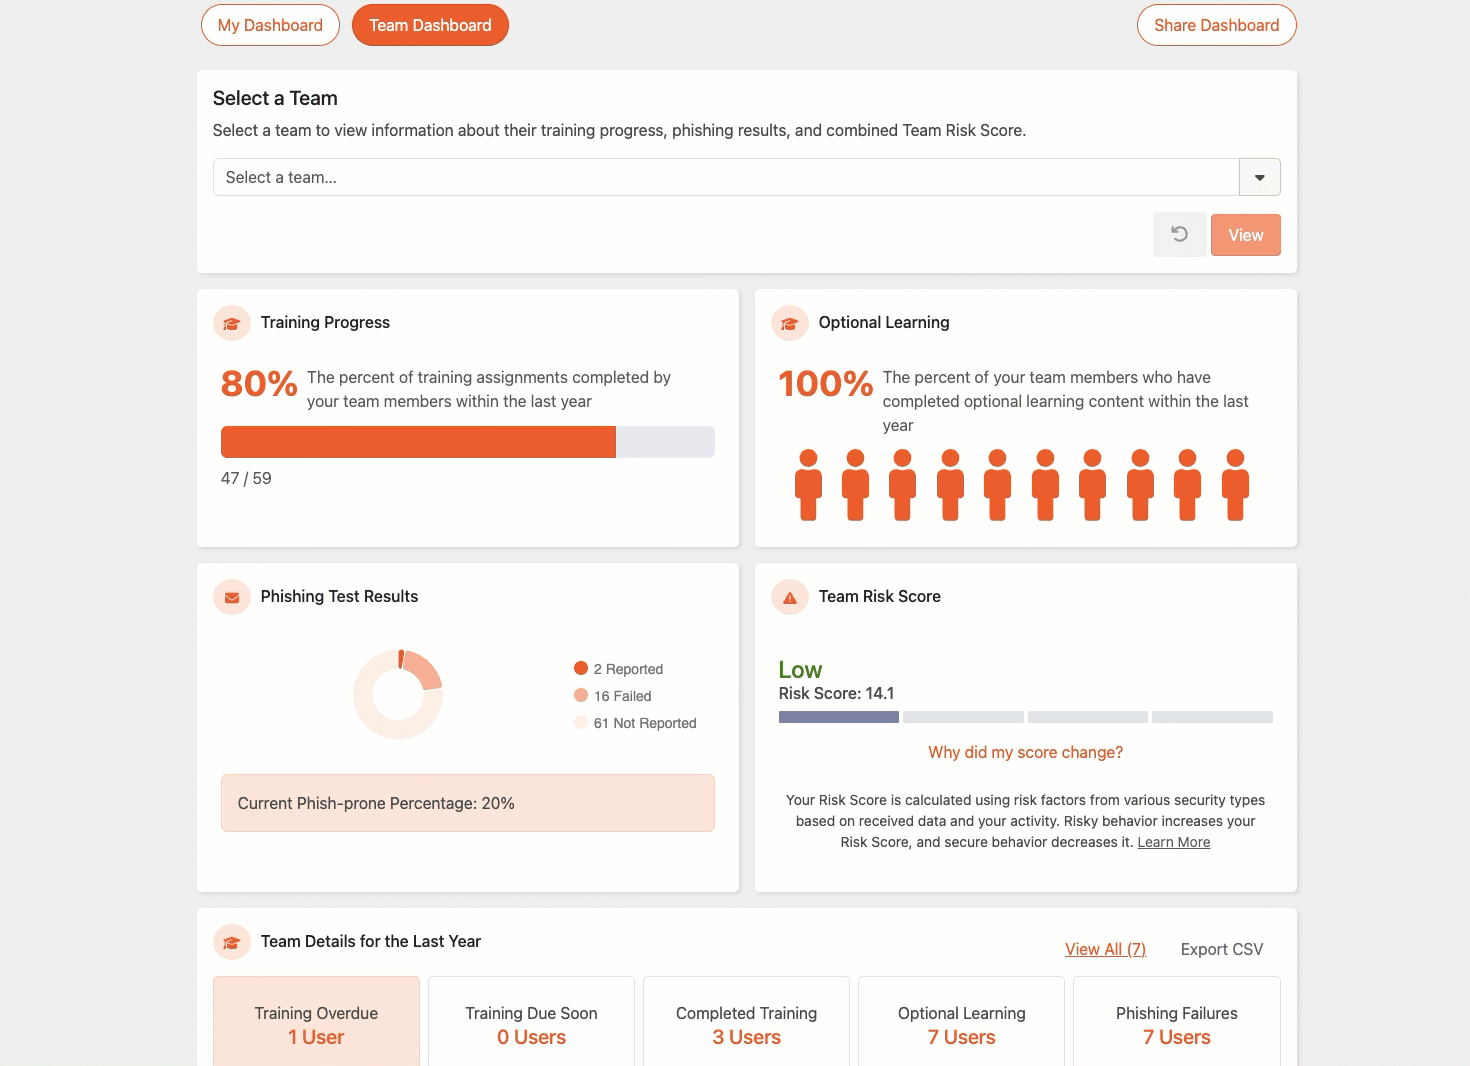
If any of your direct reports are managers, the Select a Team section will display on your dashboard. The Select a Team section allows you to choose which team you want to view on the Team Dashboard. In addition to your team, you can view the Team Dashboard for up to three levels of managers below you in your organization's management hierarchy. You will not be able to select an individual user from the Select a Team drop-down menu.
For more information about selecting a team, see the screenshot and list below:

- Select a team...: Use this drop-down list to select the manager whose team you want to view on the team dashboard.
- View: Click this button to load the team dashboard for the selected team.
- Reset: Click this button to reset the team dashboard to your team.
The Training Progress section displays the percentage of training assignments that your team has completed within the last year. This percentage does not include any optional learning content your team members have completed.

The Optional Learning section displays the percentage of team members who have completed optional learning content within the last year.

The Phishing Test Results section includes a summary of your team's PST results within the last year.
For more information about each of the three possible results, see the list below:
- Failed: This result shows the number of times that your team members have failed a PST. Failures include clicking on links, opening attachments, enabling macros on attachments, or entering data on a landing page.
- Reported: This result shows the number of times that your team members reported a PST using the Phish Alert Button (PAB).
- Not Reported: This result shows the number of times that your team members received a PST but did not fail the PST or report it.
This section also includes your team’s combined Phish-prone Percentage. For more information about Phish-prone Percentage, see our How Is Phish-prone Percentage Calculated? article.

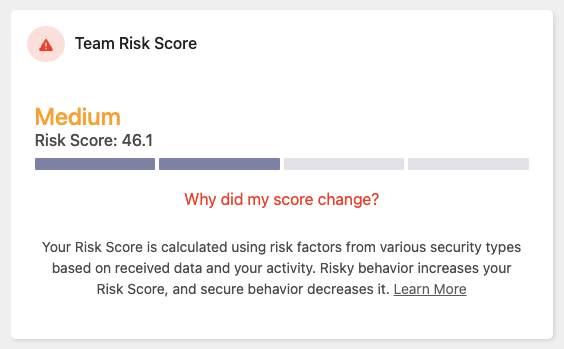
The Team Risk Score section displays your team’s current Team Risk Score. This score is based on factors such as your team's PST results and completed training. For more information, see our Learner Support: SmartRisk™ Engine and Risk Score article.
The Team Details for the Last Year section displays information about all users in the team you are viewing. This information includes the number of team members who have overdue training, have enrolled themselves in optional learning content, and failed a Phishing Security Test (PST). Depending on your organization’s preferences, you may also see a list of your team members.
You can use the subtabs in this section to filter your team’s details. For more information see the screenshot and list below:
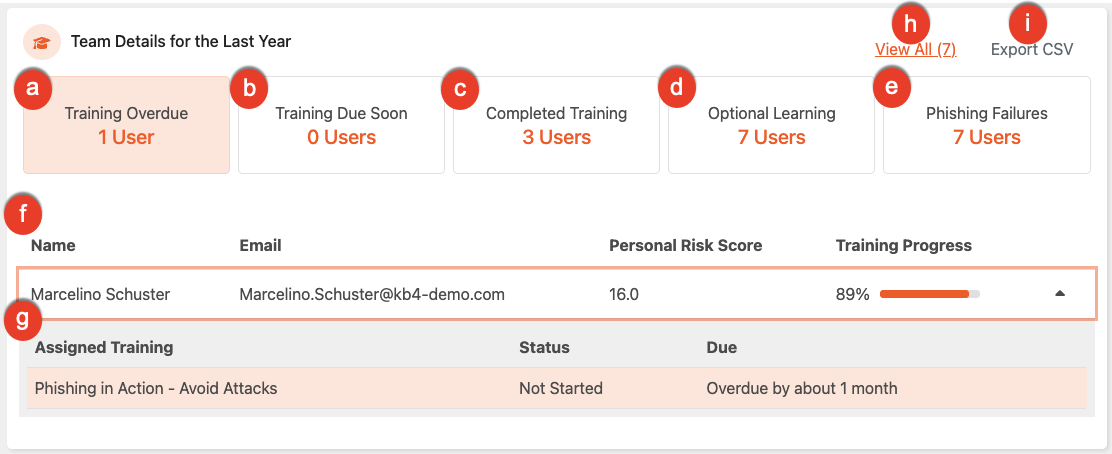
- Training Overdue: This subtab includes each team member with training assignments that are past the due date but can still be completed.
- Training Due Soon: This subtab includes each team member with training assignments due in the next seven days.
- Completed Training: This subtab includes each team member with all of their assigned training completed in the past year.
- Optional Learning: This subtab includes each team member with added optional learning content from their library in the past year.
-
Phishing Failures: This subtab includes each team member along with their total number of phishing failures and reported PSTs in the past year.
Important:We display one phishing failure per PST, even if the user has multiple failures. -
User Table: This table shows a list of all team members. Depending on your organization’s account settings, the table will display the user’s name, email address, total phishing failures, total phishing emails reported, and overall progress on assigned training campaigns.
Important: The Training Progress bar does not track optional learning. - User Information: This section displays additional information for each user depending on which subtab you have selected. For example, if you have the Phishing Failures subtab selected, you will see additional phishing information about the user. You will also see the Personal Risk Score column, which lists the risk scores of direct reports alongside existing phishing and training data. To access the information, click anywhere on the specific user’s row.
- View or Hide All: Clicking View All will display a list of all users in the team you are viewing, including those that wouldn’t normally fall under that subtab. Clicking Hide All will revert you back to the standard subtab view.
-
Export CSV: Click this button to export your team's training data as a CSV file, then choose one of three export options. After you select an option, your export is prepared and delivered as a message in your Messages inbox, where you can download the file.
- Direct reports only: Exports a summary of training and phishing results for each of your direct reports.
- Full organization tree: Exports the same summary for everyone in your management hierarchy, including all manager levels and their teams below you.
- Assigned training (last 12 months): Exports a complete record of your direct reports' assigned training from the past 12 months, with one row per training assignment. The export includes every assignment regardless of status and contains these columns: Employee Name, Email, Assigned Training, Status, Completion Date, and Due Date.
Ways to Use the Exported CSV
Because the exported CSV file gives you a clean, complete record of your team's 12-month training history, it can help you drive team insights and simplify your administrative tasks. Many managers use it to:
- Use AI for quick summaries: Upload the CSV file to a generative AI tool, such as Claude or ChatGPT, to generate written team summaries, identify engagement trends, or draft a quick update for leadership.
- Streamline performance reviews: Keep the file available during quarterly or annual employee evaluations to verify professional development and security compliance milestones without having to search for separate records.
- Create visuals for team meetings: Add the data to your preferred dashboard or charting tool to build high-level visuals that show your team's year-over-year progress during alignment meetings.