From the Reports tab of your KnowBe4 account, you can view Phishing Activity Reports to monitor your organization's phishing-related data. Phishing activity reports display comprehensive information about your users' Phishing Security Test (PST) results. You can also customize the reports to display specific data, such as PST data for individual user groups.
If you would like to export your Phishing Activity Reports for future use, you can export information from the report as a CSV file or export a report overview graph as a PDF file.
Customizing Phishing Activity Reports
When you create a Phishing Activity Report, you can apply filters to the report to view specific data. For example, to view data for users who are in a specific group and phishing campaign, you would select the group in the User Groups filter and the phishing campaign in the Phishing Campaigns filter.
To learn about the filters you can apply to Phishing Activity Reports, see the screenshot and list below:

- Phishing Activity Reports: Use this drop-down menu to select your report type. You can select either All Phishing Activity or All Phishing Activity Grouped by User, depending on how you would like to organize your data. If you select All Phishing Activity, the report will display individual PSTs. If you select All Phishing Activity Grouped by User, the report will display PST data grouped by user. To learn more about these report types, see the All Phishing Activity and All Phishing Activity Grouped by User subsections below.
-
Phishing Campaign Criteria: If you have PhishER PhishER (link opens in new window), you will have the option to only display data for PhishFlip campaigns.
Note:If you selected All Phishing Data Grouped by User in the Phishing Activity Reports drop-down menu, the Phishing Campaign Criteria filter will not display on the page. - Phishing Campaigns: Use this filter to select the phishing campaigns that you would like to display data for.
- User Groups: Use this filter to select the user groups that you would like to display data for.
-
Add Filter: You can customize your Phishing Activity Report with the following additional filters.
- Template Attack Vectors: Use this filter to select the types of attack vectors that you would like to include in your report. The attack vectors are the types of attachments that were included in the PST. For more information, see our Phishing Campaign Attachments Overview article.
- User Groups Criteria: Use this filter to select specific criteria for the user groups that you would like to display data for.
-
Search User: Use this filter to search for specific users by name or by email.
Note:If you selected All Phishing Data Grouped by User in the Phishing Activity Reports drop-down menu, the Search User filter will not be available. -
Organization Chart: Use this drop-down menu to search by user name or job title. This filter shows user data for all organization levels under the selected users or job titles. For example, you can search for a specific job title, such as Director or VP. You can also select from the two additional settings below:
- Select Include All Team Members to include the direct and indirect reports of the selected managers in the report.
- Select Include Selected Manager to include the selected manager in the report. This check box will aggregate the data of the selected manager and any selected team member in the report.
-
Phishing Security Test Outcome: Use this filter to select the test outcomes that you would like to display data for.
Note:If you selected All Phishing Data Grouped by User in the Phishing Activity Reports drop-down menu, the Phishing Security Test Outcome filter will not display on the page. - User Status: Use this filter to select Active or Archived if you would like to display only one status.
- Exclude User Groups: Use this filter to select the user groups that you would like to exclude from the report. If a user is included in both the User Groups filter and the Exclude User Groups filter, the user will be excluded from the report.
- Timeframe: Use this filter to select the date range that you would like to display data for. This date range is based on when the PST is scheduled to be sent.
- Include timestamp on PDF file: Enable this toggle to include a timestamp of when your report was last updated.
After you select your filters, click the Apply Changes button.
Viewing Phishing Activity Reports
After you customize your Phishing Activity report, your report will display a graph and a table. If you would like, you can export the graph as a PDF file and the table data as a CSV file.
To learn how to view your Phishing Activity Reports based on report type, see the subsections below.
All Phishing Activity
If you selected All Phishing Activity for your report type, your report will display detailed information for each PST, while the All Phishing Activity Grouped by User report displays combined data for all PSTs that a user has received.
For this report type, you can view the bar graph to monitor the number of PSTs that have been delivered, failed, and reported. To view the exact numbers for each of these PSTs, you can hover your mouse over the bar graph. You can also remove a bar from the graph by clicking the corresponding label in the legend at the bottom of the graph. For example, you can click Failed from the legend to remove the Failed bar from the graph.

Below the graph, you can view a table that displays information about the phishing campaigns that each user is enrolled in. The table contains a separate row for each PST included in the campaign. For example, if a user is enrolled in one phishing campaign that includes three PSTs, the report will include three rows for the user.
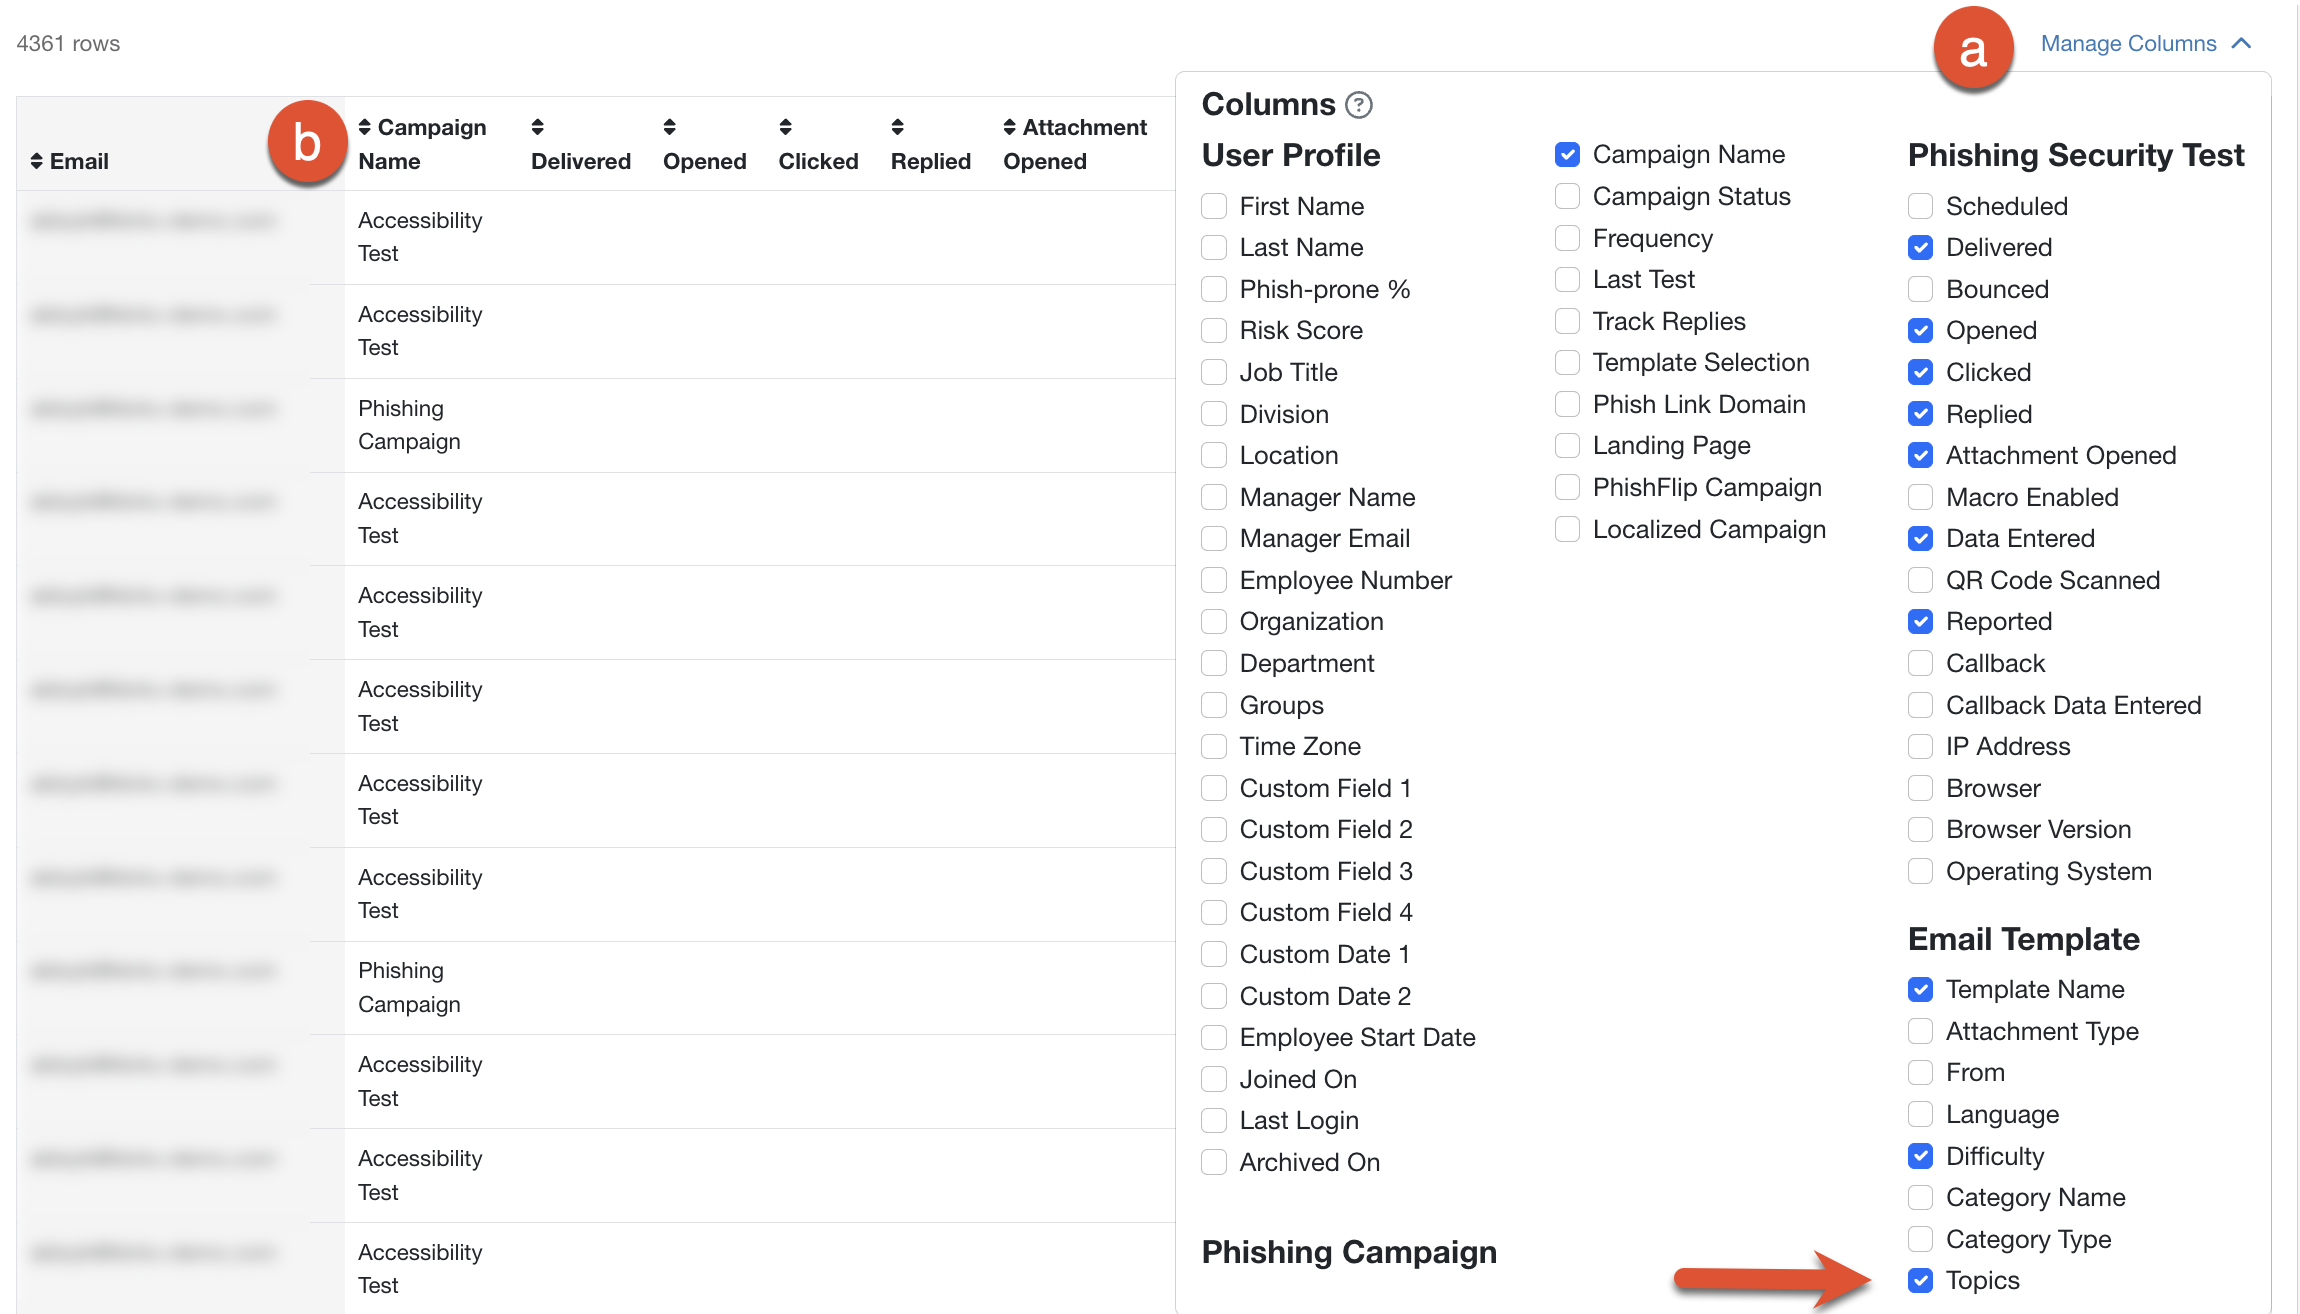
You can customize the table by selecting columns to display and sort your results. To learn how to customize the table and download your report, see the screenshot and list below:
-
Manage Columns: Select this button to display a drop-down menu that contains a list of available columns. From the drop-down menu, you can deselect the default columns and select additional columns to display in the table.
Note:If you export a CSV file of your report, the columns that you have selected in the Manage Columns drop-down menu will display in the CSV file. If you save your report by clicking the Save Report button near the top-right corner of the page, the columns that you have selected will display in the saved report. - Arrow icon: Select this icon in the column headers to sort the table’s results.
All Phishing Activity Grouped by User
If you selected All Phishing Activity Grouped by User for your report type, your report will display more general data about your users' PST results by template topics, while the All Phishing Activity report displays data for individual PSTs.
For this report type, you can view the bar graph to monitor the number of PSTs that the users have failed and reported, including the number of clicks, replies, attachments opened, macros enabled, data entered, QR codes scanned, and users’ average Phish-prone Percentage. For callback campaigns available to Diamond, SAT Foundation, and SAT Advanced subscriptions, the bar graph can also be used to monitor callbacks and callback data entered. To view the exact numbers for each of these events, you can hover your mouse over each bar in the bar graph. Next to the bar graph, you can also view the average Phish-prone Percentage, Phish-failure Percentage, and PAB-reported percentage.

Below the graph, you can view a table that displays information about the phishing campaigns that each user is enrolled in. The table contains one row for each user by combining the data for all of the phishing campaigns the user is enrolled in. For example, if a user is enrolled in one phishing campaign that includes three PSTs, the report will combine the data for the three PSTs into one row for the user.
You can customize the table by selecting columns to display and sort your results. To learn how to customize the table and download your report, see the screenshot and list below:
-
Manage Columns: Click this button to display a drop-down menu that contains a list of available columns. From the drop-down menu, you can deselect the default columns and select additional columns to display in the table.
Note:If you export a CSV file of your report, the columns that you have selected in the Manage Columns drop-down menu will display in the CSV file. If you save your report by clicking the Save Report button, the columns that you have selected will display in the saved report. - Arrow icon: Click this icon in the column headers to sort the results in the table.
Exporting Phishing Activity Reports
If you would like to export your Phishing Activity Reports, you can use the Export As button near the top-right corner of the filter options to generate a CSV or PDF File.

This will open a drop-down menu where you can choose to Generate CSV or Generate PDF. Generate CSV will generate a CSV file version of the report table. Generate PDF will generate the report’s graphs and Report Details found at the bottom of the report table.
In the top-right corner of your console, a notification bell will display when the report that you generated is ready to be downloaded. Your generated reports can also be downloaded at any time from the Download Center subtab. For more information, see the Download Center Overview.