In your KCM GRC platform, you can use reports to monitor your organization's compliance efforts. From the Metrics tab of your account, you can view the reports that KCM GRC creates for you. These reports provide metrics for many of the workflows and compliance efforts found in your account.
If you would like, you can also create custom reports. For more information, see our Custom Reporting Guide.
See the sections below to learn about the reports in each section of the Metrics page.
Jump to:Detailed Compliance ReportsSummary Compliance ReportsScope Tasks GanttPolicy Management ReportsRisk Management ReportsAdditional Reports
Detailed Compliance Reports
In the Detailed Compliance Reports section of the Metrics page, you can find reports about your scopes. In this section, you can find a report for your scopes that contain requirements if one or more of these requirements are mapped to a control. To open a report for a scope, select the scope.
When you select a scope, you'll be taken to the Detailed Report page. This page displays the requirements in your scope that are mapped to controls. Additionally, this report displays the controls that are mapped to the requirements and the tasks that have been created for the mapped controls. To export the report, click the Export to CSV button at the top-right corner of the page.
You can use the filters at the top of the page to specify which tasks the report displays. For information about these filters, see the screenshot and list below:
- From: Click the drop-down menu to specify whether the beginning date in your date range should apply to the tasks' start dates, end dates, or due dates. Then, click the date field and select a beginning date from the calendar. Alternatively, type a date into this field in the "MM/DD/YYYY" format.
- To: Click the drop-down menu to specify whether the ending date in your date range should apply to the tasks' start dates, end dates, or due dates. Then, click the date field and select an ending date from the calendar. Alternatively, type a date into this field in the "MM/DD/YYYY" format.
- Apply Filters: Click this button to apply your filters to the report.
For more information about the report, see the screenshot and list below:
- View the requirement's name. You can also click the requirement name to open the requirement.
- View the requirement's description.
- View the name of the control that is mapped to the requirement. You can click the control name to open the control. If multiple controls are mapped to the requirement, each control will be listed under the requirement.
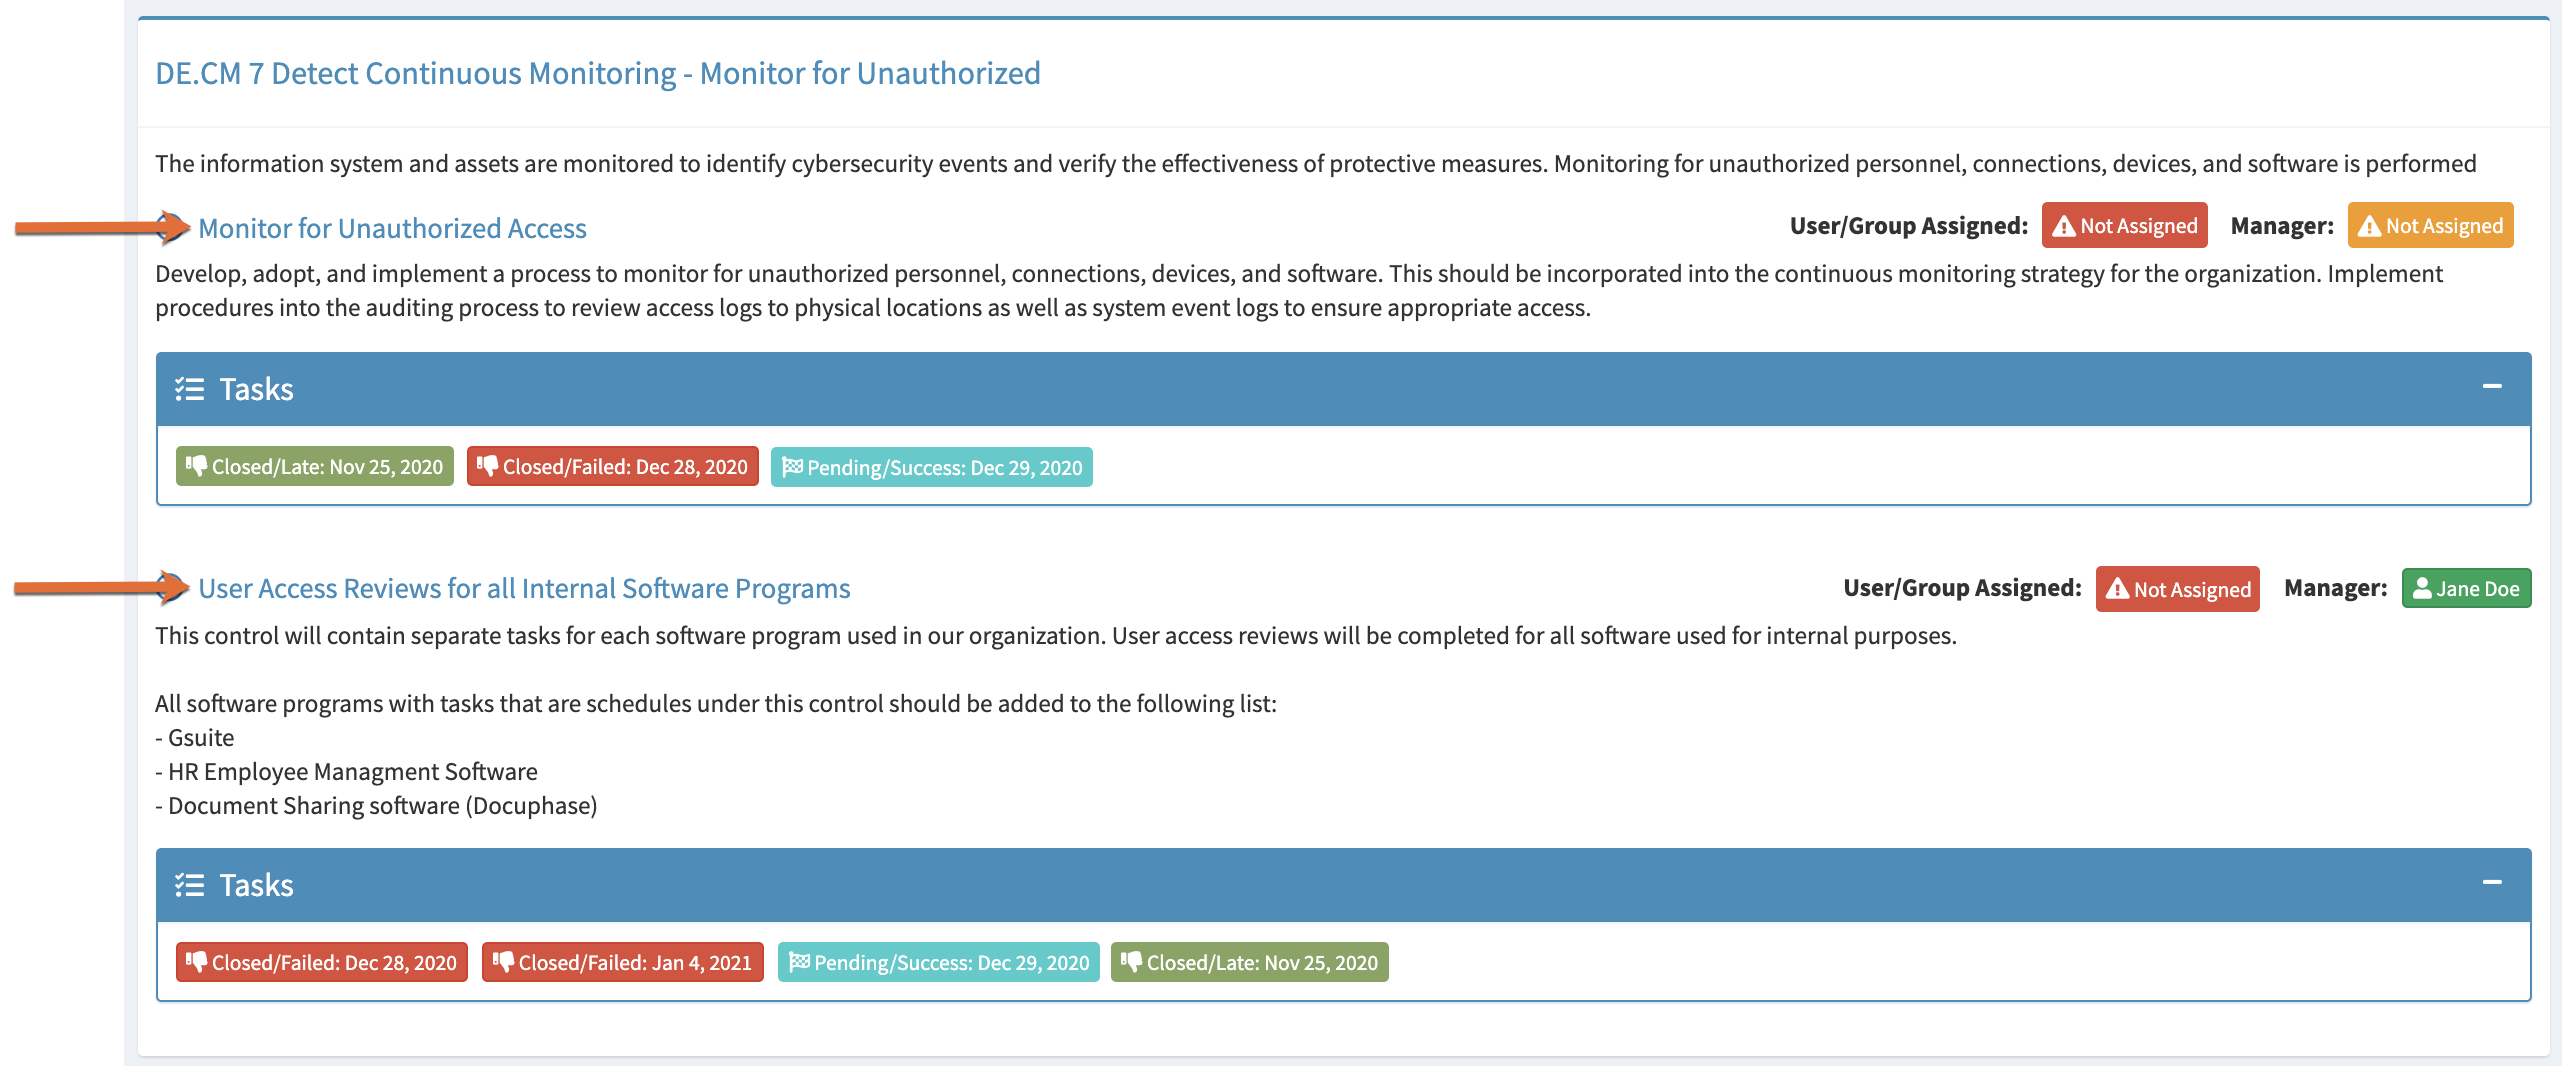
- View the description of the control that is mapped to the requirement.
-
User/Group Assigned: View the user or group is assigned to the control, if applicable. If a user is assigned to the control, their email address will display.
Tip: Assigning a user or a group to a control is optional. You can assign users to the control's tasks, instead. To learn more about assigning user groups to controls, see our Working with User Groups article.
-
Manager: View the name of the Approving Manager who is assigned to a control, if applicable.
Tip: Assigning an approving manager to a control is optional. You can assign approving managers to the control's tasks instead. For more information, see our Task Approval Workflow article.
-
Tasks: View the status and due date of the tasks that have been created for the control. You can also select a task's label to view more information about the task. Each task will have a due date and status, as outlined below:
- Active/Open:The task is currently active in your account, and the task is not past due.
- Open/Past Due: The due date for the task has passed and the task is incomplete. The task has not passed its Task Fail Interval yet.
- Closed/Late: The task was marked as complete after its due date.
-
Closed/Failed: The task has not been completed or closed, and the Task Fail Interval has passed.
Tip: Tasks that have a Failed status can still be completed. Once a Failed task is completed, the task's status will change to Closed Late.Note: Tasks will display an additional status if the task's stage is Awaiting Approval. If the task was completed before it reached the Past Due status, the task will display Pending/Success. If the task was completed after it reached the Past Due status, the task will display Pending/Late.
Summary Compliance Reports
In the Summary Compliance Reports section of the Metrics page, you can find a report for scopes in your account. Reports will only be available for scopes that contain requirements if one or more of these requirements are mapped to a control. Select a scope's name to open the report for that scope.
The Summary Report page displays all of the requirements included in the scope. This report also displays the controls that are mapped to the scoped requirements, if applicable. For more information, see the screenshot and list below: 
- The first column contains all of the requirements in your scope. The requirements are then divided into sections based on the first part of their requirement IDs, which are also known as primary IDs. Each section is divided by a header row that identifies the section by the primary ID of the requirements in that section.
- For example, in the image above, the first section contains the requirements that have the DE.AE primary ID and the second section contains the requirements that have the DE.CM primary ID.
-
Self-Assessment: The symbols in this column represent the response you selected for the requirement's self-assessment, as outlined in the table below. To learn more about scope self-assessments, see our Completing a Scope Self-Assessment article.

Met 
Partially Met 
Not Met 
No Answer 
Not Applicable - Compliance %: This percentage displays the average Control Health for all controls mapped to this requirement. Control Health is the percentage of tasks that have been completed for a control. For more information, see our Glossary of Compliance Terms.
- Expand/Collapse: In this column, an arrow will display next to requirements that are mapped to controls. Click the arrow to view the control description for the control or controls mapped to this requirement.
Scope Tasks Gantt
In the Scope Tasks Gantt section of the Metrics page, you can find a report for each scope in your account. You can also find a report that displays data for all of the scopes in your account. To open a report, click All Scopes or a scope's name.
The Task Gantt Chart is a horizontal bar chart that displays the start, end, and due dates of the control tasks that are associated with the requirements in your scope. This chart also displays the statuses of these tasks.

You can use the From and To filters at the top of the page to display the tasks that start, end, or are due within a particular date range. To narrow your results based on task status, click the Filter by Task Status field and select one or more task statuses.
In the Gantt chart, each task is represented by a horizontal bar. Each bar displays the number of days between the task's Start Date and its Due Date. The color of the bar represents the status of the task. These colors are outlined in the Due Date Task Range legend (click to view) above the Gantt chart. To view information about the task, select a bar.
From the Column in the Gantt chart, you can select a control name to open the control in a new tab.
Policy Management Reports
In the Policy Management Reports section of the Metrics page, you can find the policy campaigns that you have created in your Policy Management module. Select a campaign name to open the report for the campaign. To learn more about monitoring Policy Management campaigns, see the Monitor and Manage Campaigns section of our Policy Management Module Guide.
Risk Management Reports
In the Risk Management Reports section of the Metrics page, you can find the risk overview report. Click Risk Overview Report to open the report.
The Risk Overview Report page provides a list of the risks in your Risk Management module that have mapped controls. For more information, see the screenshot and list below: 
- Status: Use this filter to select specific statuses to display risks for.
- Category or Subcategory: Use these filters to display risks that are in a specific category or subcategory in your Risk Register.
- Select a risk to view details about the risk and the control or controls that it is mapped to.
To learn more about risk controls, see our How to Create and Map Risk Controls article.
Additional Reports
In the Additional Reports section of the Metrics page, you can find the Executive Report and Compliance Report by User.
For more information, see the descriptions below:
- Executive Report: From the Executive Report page, you can create a new executive report or view existing reports. The executive report sends emails to your organization's executives or other stakeholders, which will automatically keep them up-to-date about the status of the compliance efforts in your platform. For more information about this report, see our Executive Reporting Guide.
-
Compliance Report by User: From the Compliance Report by User page, you can view the number of closed tasks and incomplete tasks for each active user who has an Account Administrator, Scope Administrator, or Contributor user role. The number of closed tasks includes tasks with Closed Late and Satisfied statuses. The number of incomplete tasks includes tasks with Failed and Past Due statuses. You can use this report to monitor whether users are completing their assigned tasks, which will help you ensure that your organization is meeting its compliance goals. To learn more about completing tasks, see our How to Monitor and Complete Tasks article.
Note:The circle graphs on this page display the percentage of tasks that each user has closed. The graphs round to the nearest whole number. For example, if a user has completed 10.5% of all of their assigned tasks, this graph will display that the user has completed 11%. If a user has completed 10.49% of all of their assigned tasks, this graph will display that the user has completed 10%.