Industry benchmarking data allows you to see how your organization’s security awareness compares to other KnowBe4 customers. This feature can help you identify areas of strength and weakness. With this knowledge, you can customize your phishing and training to better fit your organization's needs. Use the links below to learn more about industry benchmarking.
Where This Data Comes From
Our industry benchmarking data is gathered from KnowBe4 customers who have trained their users with comprehensive training material at least once and who are phishing their users at least monthly. Benchmarking data is typically updated annually and the update is announced on the Security Awareness Training Platform Change Log.
Phishing Results
Using the Phish-prone Percentage Reports under the Reports tab and the Phishing widget on the Dashboard tab, you can compare your organization’s phishing test results to others in your industry. The report displays your organization’s Phish-prone Percentage by test, which is broken down further by failure types.
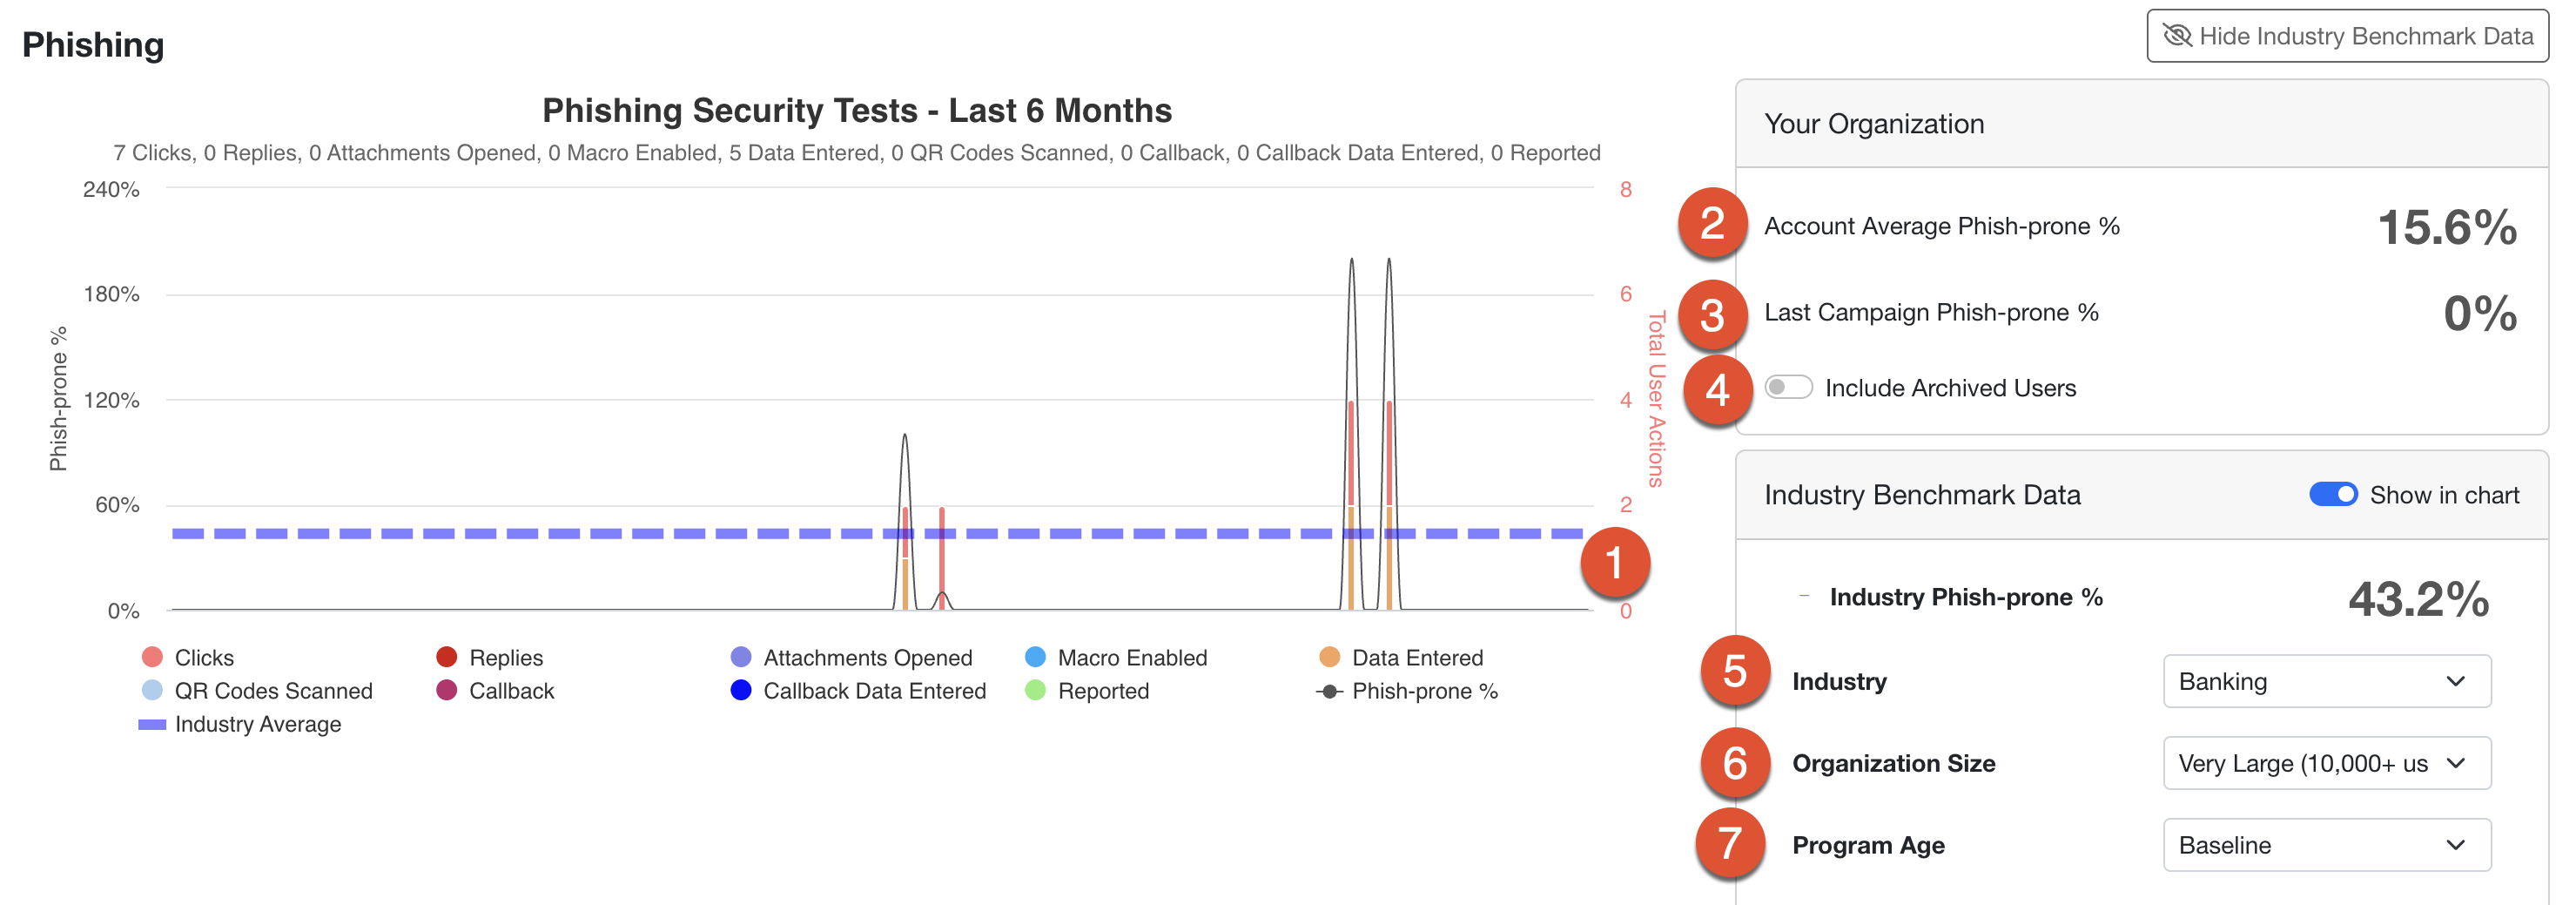
Start by selecting from the Industry, Organization Size, and Program Age drop-down menus to the right of the graph. Once you have selected your desired data, you can click the minimize icon for Industry Benchmark Data to hide these options and view the graph in a larger format. See the image below for more information:
-
Dashed line: This line represents the average Phish-prone Percentage of the selected industry. The percentage can also be seen under the Industry Benchmark Data section.
- You can hide this line using the Industry Benchmark Data toggle.
- Account Average Phish-prone Percentage: This data shows your organization's overall Phish-prone Percentage, which is based on the Phish-prone Percentage of all active users on your account, including those who have not received a Phishing Security Test (PST).
- Last Campaign Phish-prone Percentage: This data shows the overall Phish-prone Percentage of the last campaign run in your organization. Any campaigns that are hidden from reports will not affect this data.
-
Include Archived Users: Enabling this toggle recalculates both the Account Average Phish-prone % and the Last Campaign Phish-prone % to include active and archived users. This toggle is off by default. Your preference is saved in your browser, so it persists between sessions.
Note:This setting only applies to the Dashboard and does not affect Phish-prone Percentage data elsewhere in the KnowBe4 console. - Industry: This drop-down menu allows you to select the specific industry to use as a benchmark. You also have the option to compare your results against all industries.
-
Organization Size: This drop-down menu allows you to select the number of users to use as a benchmark. The organization sizes are listed below:
- Small: This option includes organizations with fewer than 250 users.
- Medium: This option includes organizations with 250-999 users.
- Large: This option includes organizations with 1,000-9,999 users.
- Very Large: This option includes organizations with 10,000+ users.
-
Program Age: This drop-down menu allows you to select the program age level to use as a benchmark. The program age options are listed below:
- Baseline: The average Phish-prone Percentage of an organization’s first phishing test.
- 90 Day: The average Phish-prone Percentage of an organization after 90 days of combined simulated phishing and security awareness training.
- 1 Year: The average Phish-prone Percentage of an organization after one year of combined simulated phishing and security awareness training.
- 2 Years: The average Phish-prone Percentage of an organization after two years of combined simulated phishing and security awareness training.
- 3 Years: The average Phish-prone Percentage of an organization after three years of combined simulated phishing and security awareness training.
To learn more information about phishing industry benchmark data, see our Phishing By Industry Benchmarking Report Phishing By Industry Benchmarking Report (link opens in new window) or our Phishing Attack Landscape and Industry Benchmarking Phishing Attack Landscape and Industry Benchmarking (link opens in new window) webinar.
Security Awareness Proficiency Assessment (SAPA)
On the Dashboard tab of your KSAT console, the Security Awareness Proficiency Assessment (SAPA) widget compares your organization's average SAPA score to an average industry-specific SAPA score. The graph on the SAPA widget shows the average score for each of the seven SAPA knowledge areas. See the image and list below for details:

-
Organization’s SAPA Score: This data shows your organization's average SAPA score. This score is based on your users' most recent SAPA scores.
- If your organization has not started SAPA, your Organization's SAPA Score will display as 0.0%.
- Industry SAPA Score: This data shows the average SAPA score for the selected industry benchmarks.
- Industry: You can click this drop-down menu to select the specific industry to use as a benchmark. You also have the option to select All Industries.
-
Organization Size: You can click this drop-down menu to select the organization size you'd like to use as a benchmark. The organization sizes are listed below:
- Small: This option includes organizations with less than 250 users.
- Medium: This option includes organizations with 250-1000 users.
- Large: This option includes organizations with 1000+ users.
For general information about SAPA, see our Security Awareness Proficiency Assessment (SAPA) Overview article.
Security Culture Survey (SCS)
On the Dashboard tab of your console, the Security Culture Survey (SCS) widget compares your users' most recent SCS scores to an average industry-specific SCS score. The graph on the SCS widget shows the average score for each SCS dimension. See the image and list below for details:

-
Organization’s SCS Score: This data shows your organization’s average score based on your users’ most recent SCS scores. This includes all users in your organization. Users not enrolled or who haven’t completed a survey will lower this score.
- If your organization has not started SCS, your Organization's SCS Score will display as N/A.
- For best results, enroll all users in an SCS campaign.
- Industry SCS Score: This data shows the average SCS score for the selected industry benchmarks.
- Industry: You can click this drop-down menu to select the specific industry to use as a benchmark. You also have the option to select All Industries.
For general information about SCS, see our Security Culture Survey (SCS) Overview article.
How Can My Organization Improve?
Remember that benchmarking results are based on customers who have trained their users at least once with comprehensive training material and who are phishing their users at least monthly. If you are not seeing desirable results, you may need to reevaluate your phishing and training plan. Follow the tips below to create an ideal security awareness program:
- If you haven’t already, we recommend setting up your Automated Security Awareness Program (ASAP). This feature will help you to develop a comprehensive security awareness program that fits the needs of your organization. In your KSAT console, go to the ASAP tab to get started.
- Review our Best Practices Guide. This guide offers tips, tricks, and best practices from KnowBe4's team to help you to achieve the results you’re looking for.
- KnowBe4 is determined to help you achieve the best results with your program. Feel free to contact your Customer Success Manager or your Account Manager for further assistance.